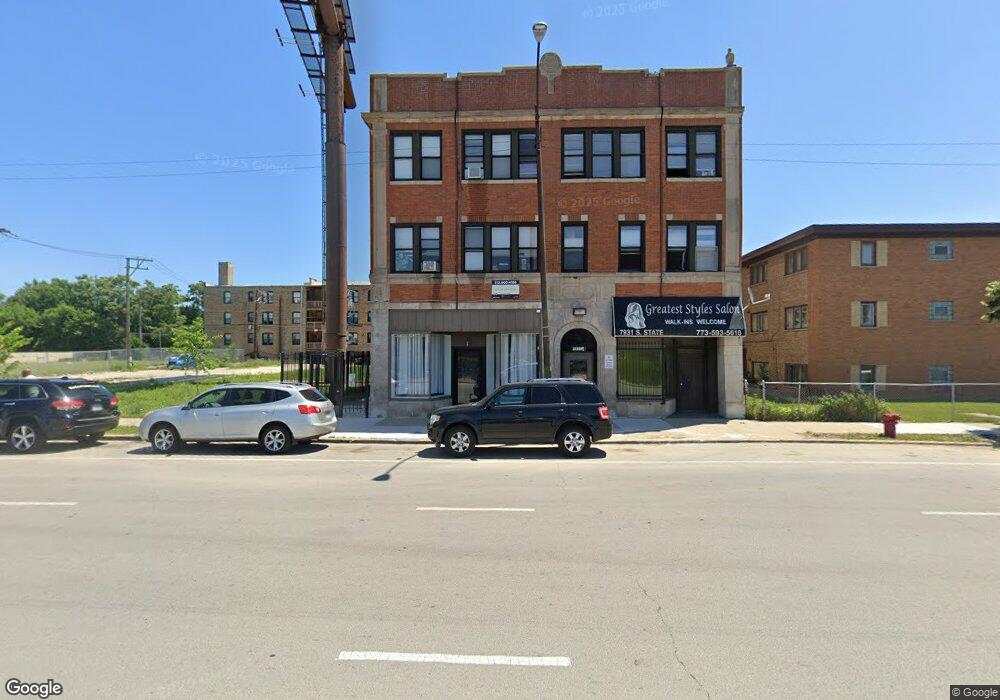
7929 S State St Chicago, IL 60619
Chatham NeighborhoodEstimated Value: $1,215,022
1
Bed
1
Bath
600
Sq Ft
$2,025/Sq Ft
Est. Value
About This Home
This home is located at 7929 S State St, Chicago, IL 60619 and is currently estimated at $1,215,022, approximately $2,025 per square foot. 7929 S State St is a home located in Cook County with nearby schools including Ruggles Elementary School and Rescue Missionary Christian School.
Ownership History
Date
Name
Owned For
Owner Type
Purchase Details
Closed on
May 3, 2019
Sold by
P4 Amc Llc
Bought by
Pp Fin Chicago 41 Llc
Current Estimated Value
Purchase Details
Closed on
Oct 23, 2012
Sold by
Selenium Management Llc
Bought by
P4 Amc Llc
Home Financials for this Owner
Home Financials are based on the most recent Mortgage that was taken out on this home.
Original Mortgage
$5,700,000
Interest Rate
3.55%
Mortgage Type
New Conventional
Purchase Details
Closed on
Jul 15, 2010
Sold by
Chicago Title Land Trust Company
Bought by
Selenium Management Llc
Purchase Details
Closed on
Oct 7, 2002
Sold by
North Star Trust Company
Bought by
Chicago Title Land Trust Company and Trust #1111083
Home Financials for this Owner
Home Financials are based on the most recent Mortgage that was taken out on this home.
Original Mortgage
$317,000
Interest Rate
7%
Mortgage Type
Commercial
Create a Home Valuation Report for This Property
The Home Valuation Report is an in-depth analysis detailing your home's value as well as a comparison with similar homes in the area
Home Values in the Area
Average Home Value in this Area
Purchase History
| Date | Buyer | Sale Price | Title Company |
|---|---|---|---|
| Pp Fin Chicago 41 Llc | -- | Attorney | |
| P4 Amc Llc | -- | -- | |
| P4 Amc Llc | -- | -- | |
| Selenium Management Llc | -- | None Available | |
| Chicago Title Land Trust Company | $417,000 | -- |
Source: Public Records
Mortgage History
| Date | Status | Borrower | Loan Amount |
|---|---|---|---|
| Previous Owner | P4 Amc Llc | $5,700,000 | |
| Previous Owner | Chicago Title Land Trust Company | $317,000 |
Source: Public Records
Tax History Compared to Growth
Tax History
| Year | Tax Paid | Tax Assessment Tax Assessment Total Assessment is a certain percentage of the fair market value that is determined by local assessors to be the total taxable value of land and additions on the property. | Land | Improvement |
|---|---|---|---|---|
| 2024 | $16,715 | $81,600 | $8,000 | $73,600 |
| 2023 | $16,294 | $79,222 | $7,200 | $72,022 |
| 2022 | $16,294 | $79,222 | $7,200 | $72,022 |
| 2021 | $15,931 | $79,221 | $7,200 | $72,021 |
| 2020 | $16,514 | $74,129 | $7,200 | $66,929 |
| 2019 | $14,893 | $74,129 | $7,200 | $66,929 |
| 2018 | $14,643 | $74,129 | $7,200 | $66,929 |
| 2017 | $13,831 | $64,250 | $6,000 | $58,250 |
| 2016 | $10,049 | $50,174 | $6,000 | $44,174 |
| 2015 | $9,194 | $50,174 | $6,000 | $44,174 |
| 2014 | $10,040 | $54,115 | $6,000 | $48,115 |
| 2013 | $9,842 | $54,115 | $6,000 | $48,115 |
Source: Public Records
Map
Nearby Homes
- 8008 S Wabash Ave
- 7950 S Lafayette Ave
- 7940 S Perry Ave
- 7811 S Wabash Ave
- 7627 S State St
- 8030 S Prairie Ave
- 7708 S Wabash Ave
- 7736 S Indiana Ave
- 7658 S Wabash Ave
- 8043 S Yale Ave
- 7741 S Indiana Ave
- 237 W 79th St
- 7646 S Wabash Ave
- 7918 S Calumet Ave
- 8126 S Wentworth Ave
- 8146 S Prairie Park Place
- 8243 S Wabash Ave
- 7720 S Prairie Ave
- 7619 S Wabash Ave
- 7635 S Michigan Ave
- 7937 S State St Unit 4B1
- 7937 S State St Unit 2BG
- 7935 S State St Unit 7A2
- 7935 S State St Unit 1AG
- 7935 S State St Unit 10D2
- 7937 S State St Unit 8B2
- 7935 S State St Unit 3A1
- 7937 S State St Unit 208B
- 7937 S State St Unit 208E
- 7939 S State St Unit 9C2
- 7939 S State St Unit 5C
- 7941 S State St Unit 10
- 7941 S State St Unit 6D1
- 7932 S Wabash Ave Unit 1A
- 7932 S Wabash Ave Unit 2B
- 7930 S Wabash Ave Unit 3B
- 7924 S Wabash Ave Unit 2
- 7920 S Wabash Ave Unit 3C
- 7920 S Wabash Ave Unit 3D
- 7920 S Wabash Ave Unit 2B