Estimated Value: $360,000 - $372,000
2
Beds
3
Baths
1,759
Sq Ft
$209/Sq Ft
Est. Value
About This Home
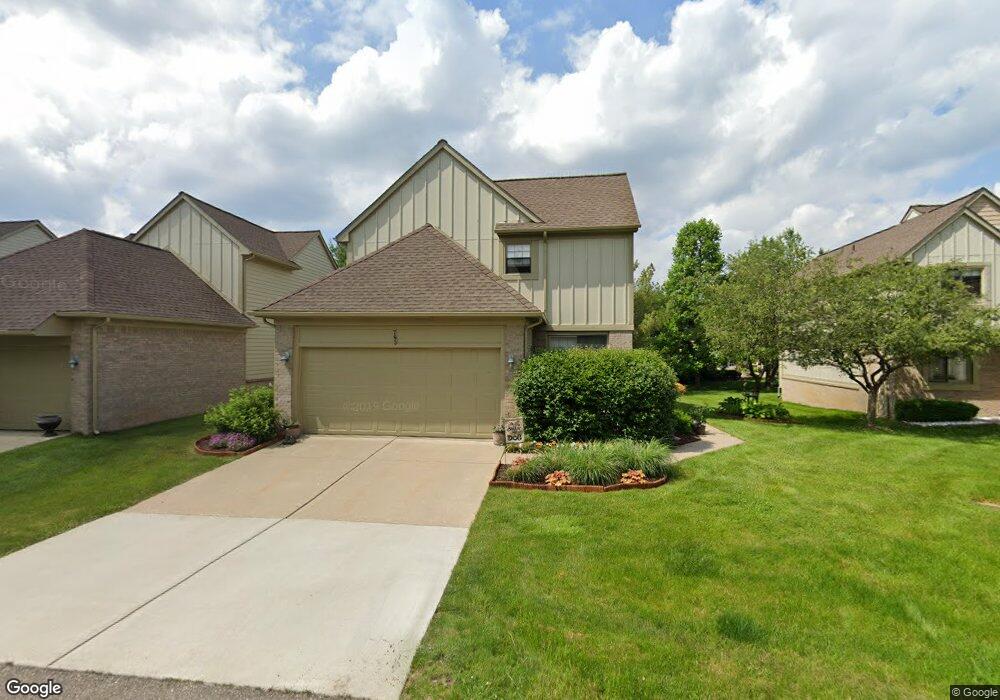
This home is located at 793 Red Maple Ln Unit 42, 1047, Wixom, MI 48393 and is currently estimated at $368,023, approximately $209 per square foot. 793 Red Maple Ln Unit 42, 1047 is a home located in Oakland County with nearby schools including Walled Lake Elementary School, Sarah G. Banks Middle School, and Walled Lake Western High School.
Ownership History
Date
Name
Owned For
Owner Type
Purchase Details
Closed on
Jul 21, 2021
Sold by
Vernon Douglas W and Vernon Jane D
Bought by
Farley Michael G and Farley Theresa A
Current Estimated Value
Home Financials for this Owner
Home Financials are based on the most recent Mortgage that was taken out on this home.
Original Mortgage
$200,000
Outstanding Balance
$181,635
Interest Rate
2.96%
Mortgage Type
New Conventional
Estimated Equity
$186,388
Purchase Details
Closed on
Sep 26, 2016
Sold by
Shaheen Nicholas
Bought by
Vernon Douglas W and Vernon Jane D
Purchase Details
Closed on
Aug 16, 1996
Sold by
West Maple Forest Inc
Bought by
Binder Robert C
Create a Home Valuation Report for This Property
The Home Valuation Report is an in-depth analysis detailing your home's value as well as a comparison with similar homes in the area
Home Values in the Area
Average Home Value in this Area
Purchase History
| Date | Buyer | Sale Price | Title Company |
|---|---|---|---|
| Farley Michael G | $324,000 | Cislo Title Co | |
| Vernon Douglas W | $205,000 | Title One Inc | |
| Binder Robert C | $165,000 | -- |
Source: Public Records
Mortgage History
| Date | Status | Borrower | Loan Amount |
|---|---|---|---|
| Open | Farley Michael G | $200,000 |
Source: Public Records
Tax History Compared to Growth
Tax History
| Year | Tax Paid | Tax Assessment Tax Assessment Total Assessment is a certain percentage of the fair market value that is determined by local assessors to be the total taxable value of land and additions on the property. | Land | Improvement |
|---|---|---|---|---|
| 2024 | $5,158 | $162,070 | $0 | $0 |
| 2023 | $4,887 | $161,300 | $0 | $0 |
| 2022 | $4,905 | $138,210 | $0 | $0 |
| 2021 | $3,998 | $121,320 | $0 | $0 |
| 2020 | $3,863 | $116,820 | $0 | $0 |
| 2019 | $4,016 | $109,680 | $0 | $0 |
| 2018 | $4,075 | $103,290 | $0 | $0 |
| 2017 | $3,963 | $99,410 | $0 | $0 |
| 2016 | $3,348 | $90,490 | $0 | $0 |
| 2015 | -- | $84,330 | $0 | $0 |
| 2014 | -- | $72,570 | $0 | $0 |
| 2011 | -- | $65,180 | $0 | $0 |
Source: Public Records
Map
Nearby Homes
- 2759 Maple Forest Dr Unit 84
- 2750 Maple Forest Dr
- 2588 Maple Forest Ct
- 746 Red Maple Ln
- 691 Chestnut Dr Unit 24
- 913 Rikki Ann Ct
- 1369 Flamingo
- 1255 Andover Dr
- 3201 Roma Ct
- 3184 Roma Ct
- 3202 Roma Ct
- 1445 Mariposa Dr
- 2406 Madison St
- 2988 Theodore
- 3010 Theodore
- 3022 Theodore E
- 1470 Nightingale
- 2225 Silvermaple Ct
- 882 Natures Cove Ct
- 570 Maplewood
- 793 Red Maple Ln Unit 1047
- 793 Red Maple Ln
- 797 Red Maple Ln Unit 97
- 789 Red Maple Ln Unit Bldg-Unit
- 789 Red Maple Ln
- 801 Red Maple Ln Unit 63
- 801 Red Maple Ln Unit 44, 63
- 785 Red Maple Ln
- 805 Red Maple Ln
- 781 Red Maple Ln
- 2693 Blue Heron Ln
- 754 Wild Rose Ct
- 2717 Blue Heron Ln
- 2669 Blue Heron Ln
- 809 Red Maple Ln Unit 61
- 755 Wild Rose Ct Unit 54
- 2645 Blue Heron Ln
- 740 Red Maple Ln Unit 89
- 740 Red Maple Ln
- 740 Red Maple Ln Unit 32, 89