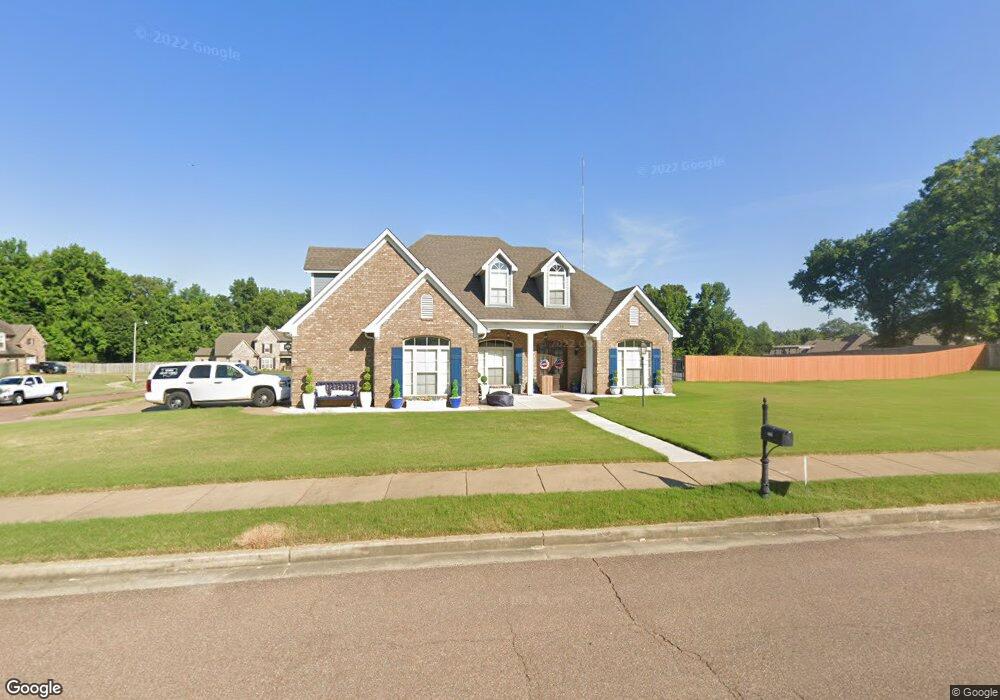
793 Shadow View Dr Hernando, MS 38632
Estimated Value: $390,000 - $436,502
4
Beds
3
Baths
2,492
Sq Ft
$167/Sq Ft
Est. Value
About This Home
This home is located at 793 Shadow View Dr, Hernando, MS 38632 and is currently estimated at $417,376, approximately $167 per square foot. 793 Shadow View Dr is a home located in DeSoto County with nearby schools including Oak Grove Central Elementary School, Hernando Elementary School, and Hernando Hills Elementary.
Ownership History
Date
Name
Owned For
Owner Type
Purchase Details
Closed on
Jun 4, 2010
Sold by
Venture Signature Homes Llc
Bought by
Rayborn Robert and Didonna Angela
Current Estimated Value
Home Financials for this Owner
Home Financials are based on the most recent Mortgage that was taken out on this home.
Original Mortgage
$197,243
Outstanding Balance
$131,055
Interest Rate
5.03%
Mortgage Type
FHA
Estimated Equity
$286,321
Purchase Details
Closed on
Feb 5, 2010
Sold by
Bancorpsouth Bank
Bought by
Venture Signature Homes Llc
Home Financials for this Owner
Home Financials are based on the most recent Mortgage that was taken out on this home.
Original Mortgage
$174,400
Interest Rate
5.07%
Mortgage Type
Seller Take Back
Create a Home Valuation Report for This Property
The Home Valuation Report is an in-depth analysis detailing your home's value as well as a comparison with similar homes in the area
Home Values in the Area
Average Home Value in this Area
Purchase History
| Date | Buyer | Sale Price | Title Company |
|---|---|---|---|
| Rayborn Robert | -- | First National Financial Tit | |
| Venture Signature Homes Llc | -- | First National Title Llc |
Source: Public Records
Mortgage History
| Date | Status | Borrower | Loan Amount |
|---|---|---|---|
| Open | Rayborn Robert | $197,243 | |
| Previous Owner | Venture Signature Homes Llc | $174,400 |
Source: Public Records
Tax History
| Year | Tax Paid | Tax Assessment Tax Assessment Total Assessment is a certain percentage of the fair market value that is determined by local assessors to be the total taxable value of land and additions on the property. | Land | Improvement |
|---|---|---|---|---|
| 2025 | $3,485 | $32,489 | $3,500 | $28,989 |
| 2024 | $2,837 | $22,612 | $3,500 | $19,112 |
| 2023 | $2,837 | $22,612 | $0 | $0 |
| 2022 | $2,444 | $19,775 | $3,500 | $16,275 |
| 2021 | $2,444 | $19,775 | $3,500 | $16,275 |
| 2020 | $2,261 | $18,461 | $0 | $0 |
| 2019 | $2,261 | $18,461 | $3,500 | $14,961 |
| 2017 | $2,289 | $33,632 | $18,566 | $15,066 |
| 2016 | $2,181 | $18,566 | $3,500 | $15,066 |
| 2015 | $2,481 | $33,632 | $18,566 | $15,066 |
| 2014 | $2,122 | $18,566 | $0 | $0 |
| 2013 | $2,122 | $18,566 | $0 | $0 |
Source: Public Records
Map
Nearby Homes
- 591 Shadow View Dr E
- 0 S Old Hwy 51 Unit 4105246
- 1107 Sabrina Dr
- 521 Abey Ln
- 1207 Howell Way
- 420 Buck Cove
- 911 Clair Cove
- 5157 U S 51
- 5163 U S 51
- 5135 U S 51
- 5167 U S 51
- 5093 U S 51
- 159 Lindsey Dr
- 1249 Howell Way
- 509 Howell Way
- 112 Forked Creek Pkwy
- 193 Crockett Loop E
- 67 Shady Lane Cove E
- 1203 Lake View Dr
- 3 Lake View Dr
- 765 Shadow View Dr
- 739 Ridge View Dr
- 724 Shadow View Cove
- 812 Shadow View Dr
- 788 Shadow View Dr
- 745 Shadow View Cove
- 836 Shadow View Dr
- 5 Shadow View
- 906 Shadow View Dr
- 696 Shadow View Dr
- 18 Shadow View Dr
- 19 Shadow View Dr
- 15 Shadow View Dr
- 20 Shadow View Dr
- 14 Shadow View Dr
- 16 Shadow View Dr
- 13 Shadow View Dr
- 12 Shadow View Dr
- 21 Shadow View Dr
- 71 Shadow View Dr
Your Personal Tour Guide
Ask me questions while you tour the home.