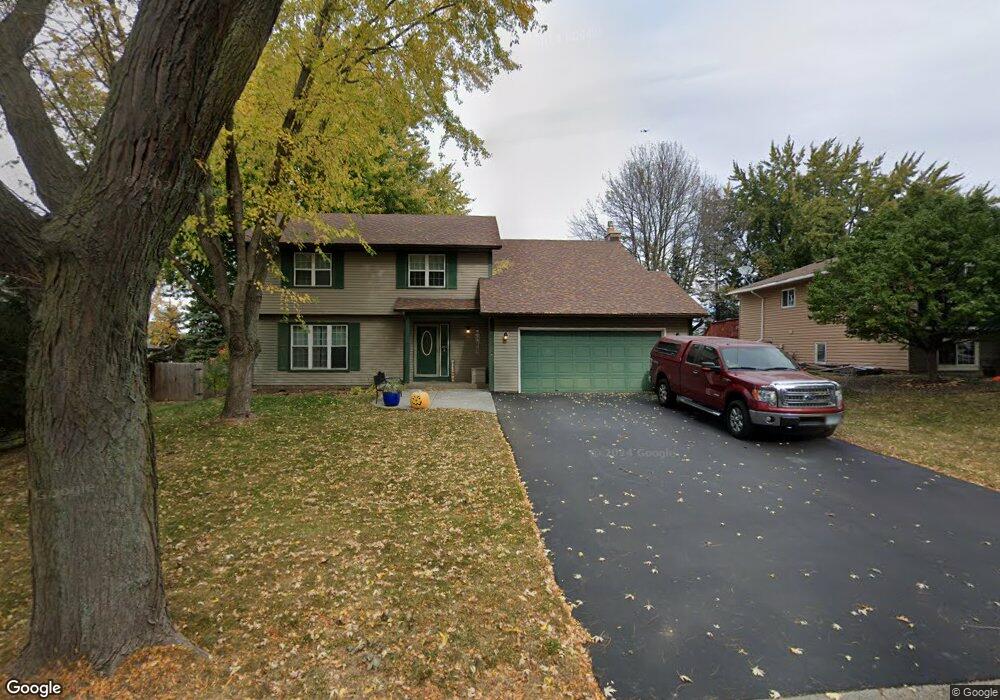
7932 66th St S Cottage Grove, MN 55016
Estimated Value: $409,433 - $437,000
4
Beds
3
Baths
2,420
Sq Ft
$174/Sq Ft
Est. Value
About This Home
This home is located at 7932 66th St S, Cottage Grove, MN 55016 and is currently estimated at $420,608, approximately $173 per square foot. 7932 66th St S is a home located in Washington County with nearby schools including Liberty Ridge Elementary School, Cottage Grove Middle School, and East Ridge High School.
Ownership History
Date
Name
Owned For
Owner Type
Purchase Details
Closed on
Mar 12, 2021
Sold by
Sivanich Sarah and Sivanich Jerome
Bought by
Cole Melissa K and Cole Patrick M
Current Estimated Value
Home Financials for this Owner
Home Financials are based on the most recent Mortgage that was taken out on this home.
Original Mortgage
$276,800
Outstanding Balance
$248,132
Interest Rate
2.7%
Mortgage Type
New Conventional
Estimated Equity
$172,476
Purchase Details
Closed on
Oct 10, 2008
Sold by
Amtrust Bank
Bought by
Noe Sarah C and Sivanich Jerome M
Home Financials for this Owner
Home Financials are based on the most recent Mortgage that was taken out on this home.
Original Mortgage
$196,910
Interest Rate
5.94%
Mortgage Type
FHA
Purchase Details
Closed on
Nov 17, 2005
Sold by
Bernard David C and Bernard Dorothy A
Bought by
Arvold William P and Arvold Kimberly C
Create a Home Valuation Report for This Property
The Home Valuation Report is an in-depth analysis detailing your home's value as well as a comparison with similar homes in the area
Home Values in the Area
Average Home Value in this Area
Purchase History
| Date | Buyer | Sale Price | Title Company |
|---|---|---|---|
| Cole Melissa K | $346,000 | Legacy Title | |
| Noe Sarah C | $200,000 | -- | |
| Arvold William P | $261,700 | -- | |
| Cole Melissa Melissa | $346,000 | -- |
Source: Public Records
Mortgage History
| Date | Status | Borrower | Loan Amount |
|---|---|---|---|
| Open | Cole Melissa K | $276,800 | |
| Previous Owner | Noe Sarah C | $196,910 | |
| Closed | Cole Melissa Melissa | $276,000 |
Source: Public Records
Tax History Compared to Growth
Tax History
| Year | Tax Paid | Tax Assessment Tax Assessment Total Assessment is a certain percentage of the fair market value that is determined by local assessors to be the total taxable value of land and additions on the property. | Land | Improvement |
|---|---|---|---|---|
| 2024 | $4,876 | $387,400 | $120,000 | $267,400 |
| 2023 | $4,876 | $377,300 | $120,000 | $257,300 |
| 2022 | $4,036 | $359,900 | $117,400 | $242,500 |
| 2021 | $4,002 | $298,900 | $97,500 | $201,400 |
| 2020 | $3,874 | $299,700 | $103,000 | $196,700 |
| 2019 | $3,842 | $282,700 | $85,000 | $197,700 |
| 2018 | $3,624 | $274,000 | $85,000 | $189,000 |
| 2017 | $3,392 | $255,400 | $82,000 | $173,400 |
| 2016 | $3,378 | $243,800 | $74,600 | $169,200 |
| 2015 | $2,950 | $215,000 | $61,300 | $153,700 |
| 2013 | -- | $188,900 | $47,800 | $141,100 |
Source: Public Records
Map
Nearby Homes
- 7976 64th Ct S
- 7987 63rd St S
- 6151 Idora Ct S
- The Caledonia Plan at Hinton Woods - Express Townhomes
- The Dalton Plan at Hinton Woods - Express Townhomes
- 6665 Hinterland Trail S
- 6709 Hinterland Trail S
- 6707 Hinterland Trail S
- 6705 Hinterland Trail S
- 6703 Hinterland Trail S
- 6701 Hinterland Trail S
- 6109 Idra Ave S
- 8301 63rd St S
- 6734 Hinterland Trail S
- 6732 Hinterland Trail S
- 6736 Hinterland Trail S
- 6740 Hinterland Trail S
- 6744 Hinterland Trail S
- 6748 Hinterland Trail S
- 6904 Innsdale Ave S
- 7952 66th St S
- 7912 66th St S
- 7972 66th St S
- 7892 66th St S
- 6610 Hyde Ave S
- 7951 66th St S
- 7872 66th St S
- 7992 66th St S
- 7971 66th St S
- 6622 Hyde Ave S
- 7871 66th St S
- 7923 64th Ct S
- 7852 66th St S
- 7941 64th Ct S
- 7991 66th St S
- 6633 Hyde Ave S
- 7851 66th St S
- 7963 64th Ct S
- 6634 Hyde Ave S
- 6362 Homestead Ln S