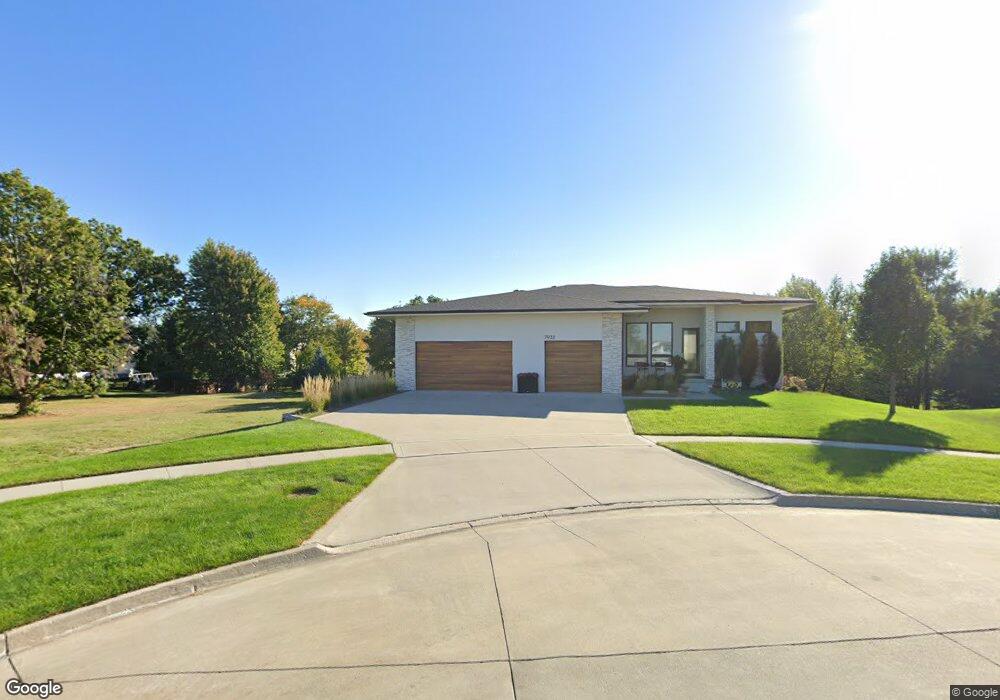
7932 Springfield Ct West Des Moines, IA 50266
Estimated Value: $476,000 - $904,000
2
Beds
5
Baths
2,045
Sq Ft
$366/Sq Ft
Est. Value
About This Home
This home is located at 7932 Springfield Ct, West Des Moines, IA 50266 and is currently estimated at $748,066, approximately $365 per square foot. 7932 Springfield Ct is a home located in Dallas County with nearby schools including Brookview Elementary School, South Middle School, and Prairieview Middle School.
Ownership History
Date
Name
Owned For
Owner Type
Purchase Details
Closed on
Feb 28, 2024
Sold by
Michaelsen Marc W and Rau Julia A
Bought by
Marc W Michaelsen Living Trust and Julia A Rau Living Trust
Current Estimated Value
Purchase Details
Closed on
Mar 21, 2018
Sold by
Arbor Home Builder Llc
Bought by
Michelsen Marc W and Rau Julia A
Home Financials for this Owner
Home Financials are based on the most recent Mortgage that was taken out on this home.
Original Mortgage
$453,100
Interest Rate
3.87%
Mortgage Type
Adjustable Rate Mortgage/ARM
Purchase Details
Closed on
Aug 2, 2017
Sold by
Jerry Bussanmas Llc
Bought by
Arbor Home Buildsers Llc
Home Financials for this Owner
Home Financials are based on the most recent Mortgage that was taken out on this home.
Original Mortgage
$645,000
Interest Rate
3.92%
Mortgage Type
Construction
Create a Home Valuation Report for This Property
The Home Valuation Report is an in-depth analysis detailing your home's value as well as a comparison with similar homes in the area
Home Values in the Area
Average Home Value in this Area
Purchase History
| Date | Buyer | Sale Price | Title Company |
|---|---|---|---|
| Marc W Michaelsen Living Trust | -- | None Listed On Document | |
| Marc W Michaelsen Living Trust | -- | None Listed On Document | |
| Michelsen Marc W | $694,500 | None Available | |
| Arbor Home Buildsers Llc | $110,000 | None Available |
Source: Public Records
Mortgage History
| Date | Status | Borrower | Loan Amount |
|---|---|---|---|
| Previous Owner | Michelsen Marc W | $453,100 | |
| Previous Owner | Arbor Home Buildsers Llc | $645,000 |
Source: Public Records
Tax History Compared to Growth
Tax History
| Year | Tax Paid | Tax Assessment Tax Assessment Total Assessment is a certain percentage of the fair market value that is determined by local assessors to be the total taxable value of land and additions on the property. | Land | Improvement |
|---|---|---|---|---|
| 2024 | $12,900 | $797,290 | $110,000 | $687,290 |
| 2023 | $12,900 | $797,290 | $110,000 | $687,290 |
| 2022 | $12,400 | $697,780 | $110,000 | $587,780 |
| 2021 | $12,400 | $678,990 | $110,000 | $568,990 |
| 2020 | $12,662 | $671,370 | $110,000 | $561,370 |
| 2019 | $6,318 | $671,370 | $110,000 | $561,370 |
| 2018 | $6,318 | $315,240 | $110,000 | $205,240 |
| 2017 | $28 | $1,420 | $1,420 | $0 |
Source: Public Records
Map
Nearby Homes
- 916 Peak Dr
- 936 Prime St
- 928 Prime St
- 920 Prime St
- 912 Prime St
- 904 Prime St
- 7639 Presence Ln
- 7647 Presence Ln
- 7655 Presence Ln
- 908 Peak Dr
- 925 Prime St
- 933 Prime St
- 748 76th St
- 850 84th St
- 7625 Escalade Ct
- 7143 Dakota Dr
- 7126 Aspen Dr
- 8302 Westown Pkwy Unit 9112
- 8302 Westown Pkwy Unit 7106
- 7153 Cody Dr
- 7946 Springfield Ct
- 7959 Springfield Ct
- 923 Somersby Ct
- 7954 Springfield Ct
- 937 Somersby Ct
- 914 78th Place
- 926 78th Place
- 7920 Ashworth Rd
- 7962 Springfield Ct
- 849 Somersby Ct
- 938 78th Place
- 874 78th Place
- 949 Somersby Ct
- 7770 Somersby Ct
- 950 78th Place
- 7893 Aspen Dr
- 7970 Springfield Ct
- 7887 Aspen Dr
- 7899 Aspen Dr
- 955 Somersby Ct