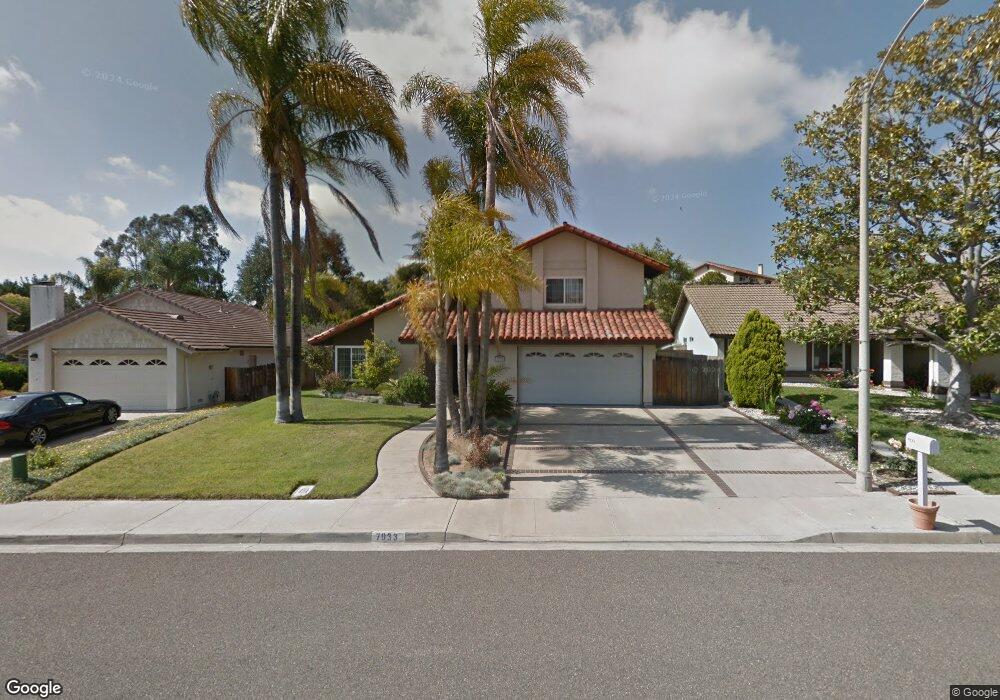
7933 Las Mientes Ln Unit 5 Carlsbad, CA 92009
La Costa NeighborhoodEstimated Value: $1,628,163 - $1,774,000
4
Beds
3
Baths
1,895
Sq Ft
$888/Sq Ft
Est. Value
About This Home
This home is located at 7933 Las Mientes Ln Unit 5, Carlsbad, CA 92009 and is currently estimated at $1,683,541, approximately $888 per square foot. 7933 Las Mientes Ln Unit 5 is a home located in San Diego County with nearby schools including El Camino Creek Elementary School, Oak Crest Middle School, and La Costa Canyon High School.
Ownership History
Date
Name
Owned For
Owner Type
Purchase Details
Closed on
Jan 15, 2002
Sold by
Urbina Philip J and Urbina Kathleen D
Bought by
Urbina Philip J and Urbina Kathleen D
Current Estimated Value
Purchase Details
Closed on
Jan 10, 1996
Sold by
Siberell John and Siberell Andrea
Bought by
Urbina Philip J and Urbina Kathleen D
Home Financials for this Owner
Home Financials are based on the most recent Mortgage that was taken out on this home.
Original Mortgage
$214,650
Outstanding Balance
$5,686
Interest Rate
7.1%
Estimated Equity
$1,677,855
Purchase Details
Closed on
Sep 14, 1989
Purchase Details
Closed on
Oct 20, 1988
Purchase Details
Closed on
Dec 11, 1987
Create a Home Valuation Report for This Property
The Home Valuation Report is an in-depth analysis detailing your home's value as well as a comparison with similar homes in the area
Home Values in the Area
Average Home Value in this Area
Purchase History
| Date | Buyer | Sale Price | Title Company |
|---|---|---|---|
| Urbina Philip J | -- | -- | |
| Urbina Philip J | $238,500 | First American Title | |
| -- | $187,500 | -- | |
| -- | $235,000 | -- | |
| -- | $184,000 | -- |
Source: Public Records
Mortgage History
| Date | Status | Borrower | Loan Amount |
|---|---|---|---|
| Open | Urbina Philip J | $214,650 |
Source: Public Records
Tax History Compared to Growth
Tax History
| Year | Tax Paid | Tax Assessment Tax Assessment Total Assessment is a certain percentage of the fair market value that is determined by local assessors to be the total taxable value of land and additions on the property. | Land | Improvement |
|---|---|---|---|---|
| 2025 | $4,693 | $396,177 | $184,265 | $211,912 |
| 2024 | $4,693 | $388,409 | $180,652 | $207,757 |
| 2023 | $4,538 | $380,794 | $177,110 | $203,684 |
| 2022 | $4,417 | $373,329 | $173,638 | $199,691 |
| 2021 | $4,329 | $366,010 | $170,234 | $195,776 |
| 2020 | $4,247 | $362,258 | $168,489 | $193,769 |
| 2019 | $4,166 | $355,156 | $165,186 | $189,970 |
| 2018 | $4,104 | $348,194 | $161,948 | $186,246 |
| 2017 | $4,037 | $341,368 | $158,773 | $182,595 |
| 2016 | $3,919 | $334,675 | $155,660 | $179,015 |
| 2015 | $3,838 | $329,649 | $153,322 | $176,327 |
| 2014 | $3,740 | $323,192 | $150,319 | $172,873 |
Source: Public Records
Map
Nearby Homes
- 2702 Jacaranda Ave
- 8010 Calle Pinon
- 7925 Calle Madrid
- 8008 Avenida Secreto
- 1278 Avenida Miguel
- 3101 Levante St
- 1931 Avenida Joaquin
- 1633 Willowspring Dr N
- 2204 Recodo Ct
- 1981 Avenida Joaquin
- 721 Summersong Ln
- 1848 Wandering Rd
- 1655 Splitrail Dr
- 7747 Caminito Monarca Unit 100
- 2002 Ladera Ct
- 2639 Pirineos Way Unit 231
- 2433 La Costa Ave Unit A
- 2630 Pirineos Way Unit 4
- 1519 Valleda Ln
- 7512 Viejo Castilla Way Unit 20
- 7931 Las Mientes Ln
- 7935 Las Mientes Ln
- 7919 Roble Place
- 7929 Las Mientes Ln
- 7937 Las Mientes Ln
- 7917 Roble Place
- 7918 Roble Place
- 7942 Las Mientes Ln
- 7944 Las Mientes Ln
- 7927 Las Mientes Ln
- 7925 Los Pinos Cir
- 7940 Las Mientes Ln
- 7925 La Capela Ln
- 7925 La Capela Place
- 7927 Los Pinos Cir
- 7946 Las Mientes Ln
- 7916 Roble Place Unit 3
- 7915 Roble Place
- 7938 Las Mientes Ln
- 7923 La Capela Ln