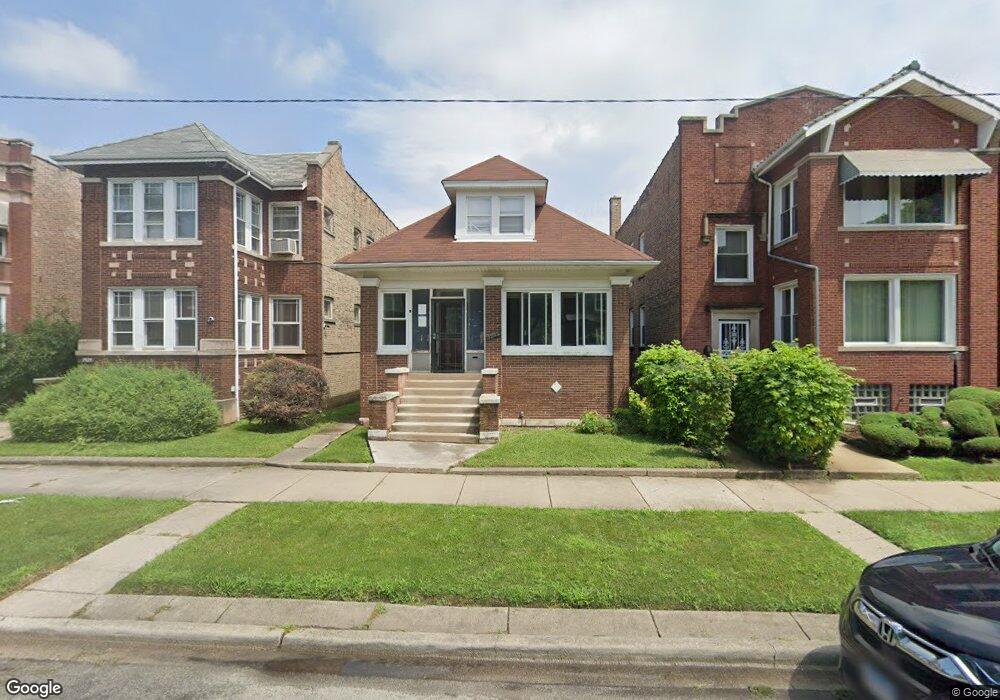
7933 S Elizabeth St Chicago, IL 60620
Auburn Gresham NeighborhoodEstimated Value: $180,000 - $291,000
3
Beds
1
Bath
1,200
Sq Ft
$176/Sq Ft
Est. Value
About This Home
This home is located at 7933 S Elizabeth St, Chicago, IL 60620 and is currently estimated at $211,745, approximately $176 per square foot. 7933 S Elizabeth St is a home located in Cook County with nearby schools including Cook Elementary School, Emil G. Hirsch Metropolitan High School, and Community Youth Development Institute.
Ownership History
Date
Name
Owned For
Owner Type
Purchase Details
Closed on
Aug 26, 2004
Sold by
Gacek Piotr
Bought by
Daniel Mariah
Current Estimated Value
Home Financials for this Owner
Home Financials are based on the most recent Mortgage that was taken out on this home.
Original Mortgage
$126,400
Outstanding Balance
$65,401
Interest Rate
6.55%
Mortgage Type
Unknown
Estimated Equity
$146,344
Purchase Details
Closed on
Apr 1, 2004
Sold by
Bank One Na
Bought by
Gacek Piotr
Purchase Details
Closed on
Jan 30, 2004
Sold by
Hill Claude
Bought by
Bank One Na
Purchase Details
Closed on
Apr 5, 2001
Sold by
Hill Claude and Hill Lucille
Bought by
Hill Claude
Home Financials for this Owner
Home Financials are based on the most recent Mortgage that was taken out on this home.
Original Mortgage
$68,000
Interest Rate
11.99%
Purchase Details
Closed on
Jan 19, 2001
Sold by
Knox Mary and Boharic Robert V
Bought by
Hill Claude and Hill Lucille
Purchase Details
Closed on
May 3, 1990
Sold by
Hill Claude Leon and Hill Lucille
Bought by
Knox Mary
Create a Home Valuation Report for This Property
The Home Valuation Report is an in-depth analysis detailing your home's value as well as a comparison with similar homes in the area
Home Values in the Area
Average Home Value in this Area
Purchase History
| Date | Buyer | Sale Price | Title Company |
|---|---|---|---|
| Daniel Mariah | $158,000 | Pntn | |
| Gacek Piotr | $79,000 | -- | |
| Bank One Na | -- | -- | |
| Hill Claude | $85,000 | -- | |
| Hill Claude | -- | -- | |
| Knox Mary | -- | -- |
Source: Public Records
Mortgage History
| Date | Status | Borrower | Loan Amount |
|---|---|---|---|
| Open | Daniel Mariah | $126,400 | |
| Previous Owner | Hill Claude | $68,000 | |
| Closed | Daniel Mariah | $31,600 |
Source: Public Records
Tax History Compared to Growth
Tax History
| Year | Tax Paid | Tax Assessment Tax Assessment Total Assessment is a certain percentage of the fair market value that is determined by local assessors to be the total taxable value of land and additions on the property. | Land | Improvement |
|---|---|---|---|---|
| 2024 | $2,676 | $14,000 | $1,984 | $12,016 |
| 2023 | $2,587 | $16,000 | $2,579 | $13,421 |
| 2022 | $2,587 | $16,000 | $2,579 | $13,421 |
| 2021 | $2,548 | $15,999 | $2,579 | $13,420 |
| 2020 | $1,603 | $10,300 | $2,579 | $7,721 |
| 2019 | $1,585 | $11,319 | $2,579 | $8,740 |
| 2018 | $1,557 | $11,319 | $2,579 | $8,740 |
| 2017 | $1,738 | $11,451 | $2,380 | $9,071 |
| 2016 | $1,793 | $11,451 | $2,380 | $9,071 |
| 2015 | $1,618 | $11,451 | $2,380 | $9,071 |
| 2014 | $1,537 | $10,850 | $2,182 | $8,668 |
| 2013 | $1,495 | $10,850 | $2,182 | $8,668 |
Source: Public Records
Map
Nearby Homes
- 7917 S Elizabeth St
- 7918 S Throop St
- 8004 S May St
- 1203 W 78th Place
- 8015 S May St
- 8011 S Ada St
- 7822 S Throop St
- 8019 S Ada St
- 8044 S May St
- 8025 S Loomis Blvd
- 7934 S Loomis Blvd
- 8029 S Loomis Blvd
- 8111 S Throop St
- 8008 S Loomis Blvd
- 7923 S Carpenter St
- 8032 S Carpenter St
- 1022 W 79th St
- 7835 S Carpenter St
- 8030 S Morgan St
- 7826 S Morgan St
- 7929 S Elizabeth St Unit 2
- 7935 S Elizabeth St
- 7925 S Elizabeth St Unit 2
- 7939 S Elizabeth St Unit 1
- 7923 S Elizabeth St
- 7943 S Elizabeth St
- 7919 S Elizabeth St Unit 2
- 7919 S Elizabeth St
- 7945 S Elizabeth St
- 7945 S Elizabeth St
- 7949 S Elizabeth St
- 7932 S Elizabeth St
- 7915 S Elizabeth St
- 7928 S Elizabeth St Unit 2
- 7928 S Elizabeth St
- 7936 S Elizabeth St
- 7936 S Elizabeth St
- 7926 S Elizabeth St Unit 1
- 7926 S Elizabeth St
- 7940 S Elizabeth St