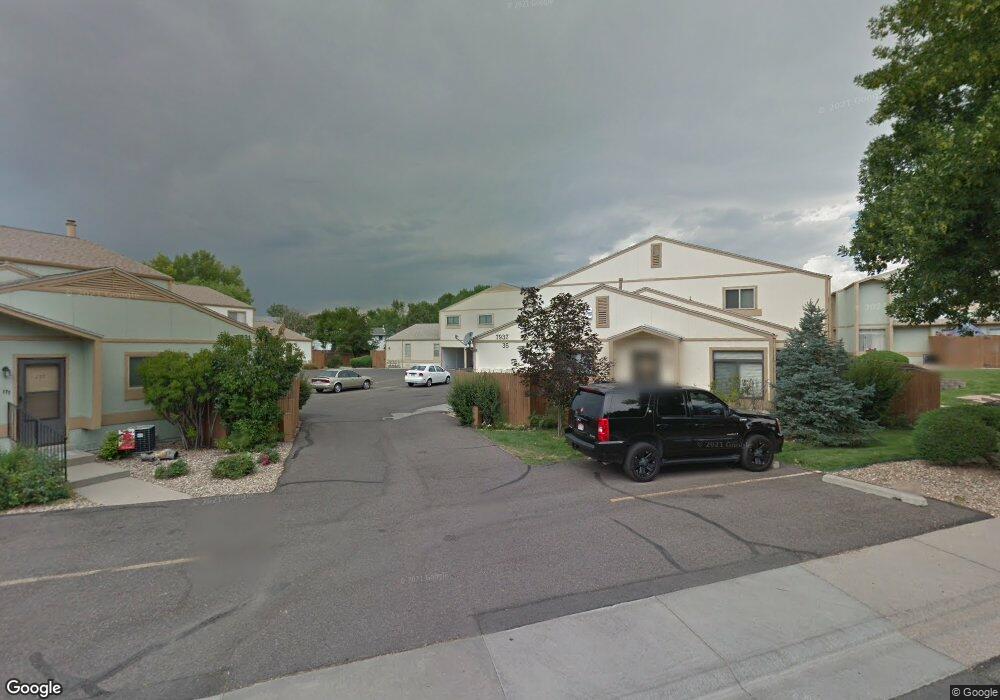
7935 Chase Cir Unit 169 Arvada, CO 80003
Wood Creek NeighborhoodEstimated Value: $279,232 - $312,000
2
Beds
1
Bath
841
Sq Ft
$352/Sq Ft
Est. Value
About This Home
This home is located at 7935 Chase Cir Unit 169, Arvada, CO 80003 and is currently estimated at $296,308, approximately $352 per square foot. 7935 Chase Cir Unit 169 is a home located in Jefferson County with nearby schools including Swanson Elementary School, Chester W. Nimitz Middle School, and North Arvada Middle School.
Ownership History
Date
Name
Owned For
Owner Type
Purchase Details
Closed on
Oct 23, 2018
Sold by
Olive John
Bought by
Olive Jaime Louise
Current Estimated Value
Purchase Details
Closed on
Feb 10, 2017
Sold by
Freyta Douglas D and Freyta Ruth L
Bought by
Olive John
Purchase Details
Closed on
Sep 10, 2013
Sold by
Pierce Frank L and Pierce Pamela J
Bought by
Freyta Douglas D and Freyta Ruth L
Home Financials for this Owner
Home Financials are based on the most recent Mortgage that was taken out on this home.
Original Mortgage
$78,960
Interest Rate
4.25%
Mortgage Type
Adjustable Rate Mortgage/ARM
Purchase Details
Closed on
Jun 28, 2002
Sold by
Klaver Barbara C
Bought by
Pierce Lucille M and Pierce Frank L
Home Financials for this Owner
Home Financials are based on the most recent Mortgage that was taken out on this home.
Original Mortgage
$111,065
Interest Rate
6.73%
Mortgage Type
FHA
Create a Home Valuation Report for This Property
The Home Valuation Report is an in-depth analysis detailing your home's value as well as a comparison with similar homes in the area
Home Values in the Area
Average Home Value in this Area
Purchase History
| Date | Buyer | Sale Price | Title Company |
|---|---|---|---|
| Olive Jaime Louise | -- | None Available | |
| Olive John | $196,000 | None Available | |
| Freyta Douglas D | $98,700 | None Available | |
| Pierce Lucille M | $114,500 | -- |
Source: Public Records
Mortgage History
| Date | Status | Borrower | Loan Amount |
|---|---|---|---|
| Previous Owner | Freyta Douglas D | $78,960 | |
| Previous Owner | Pierce Lucille M | $111,065 |
Source: Public Records
Tax History Compared to Growth
Tax History
| Year | Tax Paid | Tax Assessment Tax Assessment Total Assessment is a certain percentage of the fair market value that is determined by local assessors to be the total taxable value of land and additions on the property. | Land | Improvement |
|---|---|---|---|---|
| 2024 | $1,586 | $16,355 | $6,030 | $10,325 |
| 2023 | $1,586 | $16,355 | $6,030 | $10,325 |
| 2022 | $1,482 | $15,128 | $4,170 | $10,958 |
| 2021 | $1,506 | $15,563 | $4,290 | $11,273 |
| 2020 | $1,410 | $14,615 | $4,290 | $10,325 |
| 2019 | $1,391 | $14,615 | $4,290 | $10,325 |
| 2018 | $1,141 | $11,651 | $3,600 | $8,051 |
| 2017 | $1,044 | $11,651 | $3,600 | $8,051 |
| 2016 | $804 | $8,446 | $2,866 | $5,580 |
| 2015 | $646 | $8,446 | $2,866 | $5,580 |
| 2014 | $646 | $6,376 | $2,229 | $4,147 |
Source: Public Records
Map
Nearby Homes
- 7915 Chase Cir Unit 153
- 7917 Chase Cir Unit 160
- 5690 W 79th Ave
- 7984 Chase Cir Unit 68
- 7973 Chase Cir Unit 56
- 5790 W 79th Ave
- 7977 Chase Cir Unit 47
- 7974 Chase Cir Unit 77
- 7980 Chase Cir Unit F
- 5743 W 76th Dr
- 7680 Depew St Unit 1424
- 7958 Harlan St
- 5620 W 80th Place Unit 67
- 5550 W 80th Place Unit 12
- 5550 W 80th Place Unit 23
- 5690 W 80th Place Unit 98
- 7656 Depew St Unit 1802
- 5423 W 76th Ave Unit 503
- 5403 W 76th Ave Unit 617
- 7576 Eaton St
- 7935 Chase Cir Unit 172
- 7935 Chase Cir Unit 171
- 7937 Chase Cir Unit 175
- 7937 Chase Cir Unit 174
- 7937 Chase Cir Unit 173
- 7953 Chase #199 Cir
- 7953 Chase Cir Unit 200
- 7953 Chase Cir Unit 199
- 7953 Chase Cir Unit 198
- 7953 Chase Cir Unit 197
- 7933 Chase Cir Unit 184
- 7933 Chase Cir Unit 183
- 7933 Chase Cir Unit 181
- 7951 Chase Cir Unit 196
- 7951 Chase Cir Unit 195
- 7951 Chase Cir Unit 194
- 7951 Chase Cir Unit 193
- 7951 Chase Cir
- 7931 Chase Cir Unit 180
- 7931 Chase Cir Unit 179