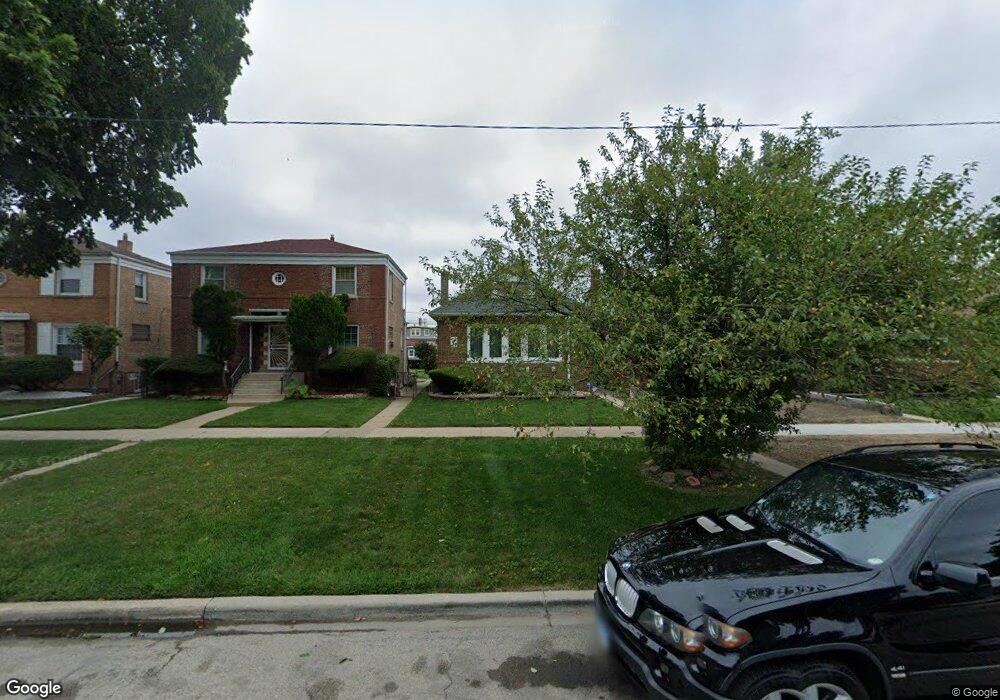
7937 S Michigan Ave Chicago, IL 60619
Chatham NeighborhoodEstimated Value: $142,000 - $582,075
4
Beds
1
Bath
1,012
Sq Ft
$287/Sq Ft
Est. Value
About This Home
This home is located at 7937 S Michigan Ave, Chicago, IL 60619 and is currently estimated at $290,519, approximately $287 per square foot. 7937 S Michigan Ave is a home located in Cook County with nearby schools including Ruggles Elementary School and Rescue Missionary Christian School.
Ownership History
Date
Name
Owned For
Owner Type
Purchase Details
Closed on
Jan 7, 2008
Sold by
Nicholson Dave
Bought by
Francis Delores
Current Estimated Value
Home Financials for this Owner
Home Financials are based on the most recent Mortgage that was taken out on this home.
Original Mortgage
$397,500
Outstanding Balance
$211,570
Interest Rate
3.31%
Mortgage Type
Reverse Mortgage Home Equity Conversion Mortgage
Estimated Equity
$78,949
Purchase Details
Closed on
Nov 30, 1994
Sold by
Parker Michael C
Bought by
Francis Delores and Nicholson Dave
Home Financials for this Owner
Home Financials are based on the most recent Mortgage that was taken out on this home.
Original Mortgage
$94,376
Interest Rate
8.91%
Mortgage Type
FHA
Purchase Details
Closed on
Oct 16, 1993
Sold by
Lasalle National Trust Na
Bought by
Parker Michael C
Home Financials for this Owner
Home Financials are based on the most recent Mortgage that was taken out on this home.
Original Mortgage
$73,500
Interest Rate
7.02%
Create a Home Valuation Report for This Property
The Home Valuation Report is an in-depth analysis detailing your home's value as well as a comparison with similar homes in the area
Home Values in the Area
Average Home Value in this Area
Purchase History
| Date | Buyer | Sale Price | Title Company |
|---|---|---|---|
| Francis Delores | -- | None Available | |
| Francis Delores | $142,500 | 1St American Title | |
| Parker Michael C | $40,000 | -- |
Source: Public Records
Mortgage History
| Date | Status | Borrower | Loan Amount |
|---|---|---|---|
| Open | Francis Delores | $397,500 | |
| Previous Owner | Francis Delores | $94,376 | |
| Previous Owner | Parker Michael C | $73,500 |
Source: Public Records
Tax History Compared to Growth
Tax History
| Year | Tax Paid | Tax Assessment Tax Assessment Total Assessment is a certain percentage of the fair market value that is determined by local assessors to be the total taxable value of land and additions on the property. | Land | Improvement |
|---|---|---|---|---|
| 2024 | $1,484 | $12,600 | $3,600 | $9,000 |
| 2023 | $1,408 | $13,000 | $4,800 | $8,200 |
| 2022 | $1,408 | $13,000 | $4,800 | $8,200 |
| 2021 | $958 | $13,000 | $4,800 | $8,200 |
| 2020 | $989 | $11,345 | $3,840 | $7,505 |
| 2019 | $986 | $12,467 | $3,840 | $8,627 |
| 2018 | $971 | $12,467 | $3,840 | $8,627 |
| 2017 | $1,040 | $12,979 | $3,360 | $9,619 |
| 2016 | $1,451 | $12,979 | $3,360 | $9,619 |
| 2015 | $1,395 | $12,979 | $3,360 | $9,619 |
| 2014 | $1,383 | $12,137 | $2,880 | $9,257 |
| 2013 | $1,388 | $12,137 | $2,880 | $9,257 |
Source: Public Records
Map
Nearby Homes
- 8008 S Wabash Ave
- 7811 S Wabash Ave
- 8030 S Prairie Ave
- 7918 S Calumet Ave
- 7736 S Indiana Ave
- 7741 S Indiana Ave
- 7738 S Wabash Ave
- 7950 S Lafayette Ave
- 7708 S Wabash Ave
- 8032 S King Dr
- 8146 S Prairie Park Place
- 7940 S Perry Ave
- 7658 S Wabash Ave
- 7635 S Michigan Ave
- 7646 S Wabash Ave
- 7627 S State St
- 7808 S Vernon Ave
- 8153 S Calumet Ave
- 7619 S Wabash Ave
- 7627 S Prairie Ave
- 7939 S Michigan Ave
- 7933 S Michigan Ave
- 7943 S Michigan Ave
- 7929 S Michigan Ave
- 7945 S Michigan Ave
- 7949 S Michigan Ave
- 7953 S Michigan Ave
- 7821 S Michigan Ave
- 7936 S Indiana Ave
- 7932 S Indiana Ave
- 7942 S Indiana Ave
- 7917 S Michigan Ave
- 7928 S Indiana Ave Unit 2E
- 7928 S Indiana Ave Unit 1W
- 7928 S Indiana Ave Unit 2F
- 7928 S Indiana Ave Unit 1F
- 7928 S Indiana Ave
- 7930 S Indiana Ave Unit 2S
- 7944 S Indiana Ave