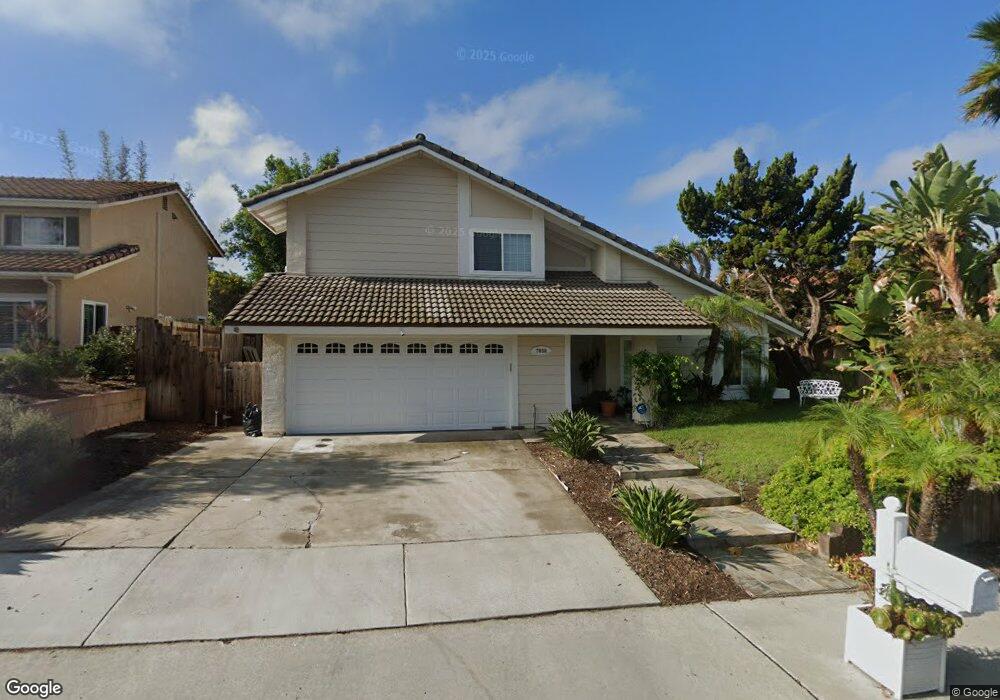
7938 Los Pinos Cir Unit 3 Carlsbad, CA 92009
La Costa NeighborhoodEstimated Value: $1,446,626 - $1,658,000
4
Beds
3
Baths
1,895
Sq Ft
$840/Sq Ft
Est. Value
About This Home
This home is located at 7938 Los Pinos Cir Unit 3, Carlsbad, CA 92009 and is currently estimated at $1,592,157, approximately $840 per square foot. 7938 Los Pinos Cir Unit 3 is a home located in San Diego County with nearby schools including El Camino Creek Elementary School, Oak Crest Middle School, and La Costa Canyon High School.
Ownership History
Date
Name
Owned For
Owner Type
Purchase Details
Closed on
Aug 30, 2013
Sold by
Guzik John Anthony and Guzik Karen Bohrer
Bought by
Guzik John Anthony
Current Estimated Value
Purchase Details
Closed on
Jul 29, 2005
Sold by
Guzik John and Guzik Karen
Bought by
Guzik John and Guzik Karen
Home Financials for this Owner
Home Financials are based on the most recent Mortgage that was taken out on this home.
Original Mortgage
$359,600
Outstanding Balance
$186,469
Interest Rate
5.46%
Mortgage Type
New Conventional
Estimated Equity
$1,405,688
Purchase Details
Closed on
Mar 14, 2003
Sold by
Gallegos Raymond and Gallegos Lucia A
Bought by
Gusik John and Gusik Karen
Home Financials for this Owner
Home Financials are based on the most recent Mortgage that was taken out on this home.
Original Mortgage
$344,000
Interest Rate
5.73%
Create a Home Valuation Report for This Property
The Home Valuation Report is an in-depth analysis detailing your home's value as well as a comparison with similar homes in the area
Home Values in the Area
Average Home Value in this Area
Purchase History
| Date | Buyer | Sale Price | Title Company |
|---|---|---|---|
| Guzik John Anthony | -- | None Available | |
| Guzik John | -- | Fidelity National Title Co | |
| Gusik John | $430,000 | Chicago Title Co |
Source: Public Records
Mortgage History
| Date | Status | Borrower | Loan Amount |
|---|---|---|---|
| Open | Guzik John | $359,600 | |
| Closed | Gusik John | $344,000 | |
| Closed | Gusik John | $43,000 |
Source: Public Records
Tax History Compared to Growth
Tax History
| Year | Tax Paid | Tax Assessment Tax Assessment Total Assessment is a certain percentage of the fair market value that is determined by local assessors to be the total taxable value of land and additions on the property. | Land | Improvement |
|---|---|---|---|---|
| 2025 | $7,117 | $622,765 | $434,490 | $188,275 |
| 2024 | $7,117 | $610,555 | $425,971 | $184,584 |
| 2023 | $6,909 | $598,584 | $417,619 | $180,965 |
| 2022 | $6,742 | $586,848 | $409,431 | $177,417 |
| 2021 | $6,627 | $575,342 | $401,403 | $173,939 |
| 2020 | $6,516 | $569,444 | $397,288 | $172,156 |
| 2019 | $6,390 | $558,280 | $389,499 | $168,781 |
| 2018 | $6,285 | $547,334 | $381,862 | $165,472 |
| 2017 | $6,180 | $536,603 | $374,375 | $162,228 |
| 2016 | $5,994 | $526,083 | $367,035 | $159,048 |
| 2015 | $5,885 | $518,181 | $361,522 | $156,659 |
| 2014 | $5,748 | $508,032 | $354,441 | $153,591 |
Source: Public Records
Map
Nearby Homes
- 2702 Jacaranda Ave
- 7941 Calle Madrid Unit 4
- 8010 Calle Pinon
- 8008 Avenida Secreto
- 7925 Calle Madrid
- 1278 Avenida Miguel
- 2204 Recodo Ct
- 1633 Willowspring Dr N
- 3356 Corte Tiburon
- 1931 Avenida Joaquin
- 1981 Avenida Joaquin
- 1848 Wandering Rd
- 721 Summersong Ln
- 3101 Levante St
- 2606 Galicia Way
- 7747 Caminito Monarca Unit 100
- 2002 Ladera Ct
- 1655 Splitrail Dr
- 1519 Valleda Ln
- 7570 Gibraltar St Unit 101
- 7940 Los Pinos Cir
- 7936 Los Pinos Cir
- 7935 Represa Cir
- 7937 Represa Cir
- 7934 Los Pinos Cir Unit 3
- 7942 Los Pinos Cir
- 7918 Rocoso Ln Unit 3
- 7933 Represa Cir
- 7939 Represa Cir
- 7920 Rocoso Ln
- 7920 Rocoso Ln Unit 1
- 7932 Los Pinos Cir
- 7944 Los Pinos Cir
- 7919 Rocoso Ln
- 7931 Represa Cir
- 7916 Rocoso Ln
- 7941 Represa Cir
- 7946 Los Pinos Cir Unit 3
- 7936 Represa Cir
- 7934 Represa Cir