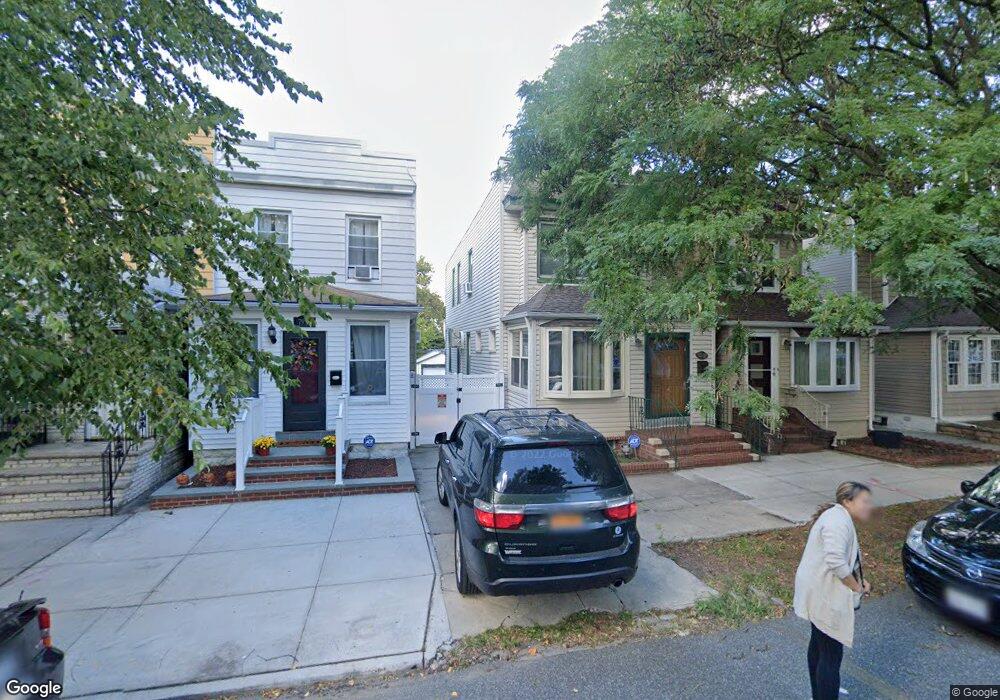
7939 77th Rd Ridgewood, NY 11385
Glendale NeighborhoodEstimated Value: $749,713 - $807,000
--
Bed
--
Bath
1,248
Sq Ft
$618/Sq Ft
Est. Value
About This Home
This home is located at 7939 77th Rd, Ridgewood, NY 11385 and is currently estimated at $771,428, approximately $618 per square foot. 7939 77th Rd is a home located in Queens County with nearby schools including I.S. 119 the Glendale and Elm Community Charter School.
Ownership History
Date
Name
Owned For
Owner Type
Purchase Details
Closed on
Aug 8, 2016
Sold by
Crawford Patricia K
Bought by
Adames Jesus and Cosme Juny
Current Estimated Value
Home Financials for this Owner
Home Financials are based on the most recent Mortgage that was taken out on this home.
Original Mortgage
$608,256
Outstanding Balance
$485,317
Interest Rate
3.48%
Mortgage Type
Purchase Money Mortgage
Estimated Equity
$286,111
Purchase Details
Closed on
Apr 13, 2007
Sold by
Crawford James L and Michael Dikman Esq %
Bought by
Crawford Patricia K
Create a Home Valuation Report for This Property
The Home Valuation Report is an in-depth analysis detailing your home's value as well as a comparison with similar homes in the area
Home Values in the Area
Average Home Value in this Area
Purchase History
| Date | Buyer | Sale Price | Title Company |
|---|---|---|---|
| Adames Jesus | $594,000 | -- | |
| Crawford Patricia K | -- | -- |
Source: Public Records
Mortgage History
| Date | Status | Borrower | Loan Amount |
|---|---|---|---|
| Open | Adames Jesus | $608,256 |
Source: Public Records
Tax History Compared to Growth
Tax History
| Year | Tax Paid | Tax Assessment Tax Assessment Total Assessment is a certain percentage of the fair market value that is determined by local assessors to be the total taxable value of land and additions on the property. | Land | Improvement |
|---|---|---|---|---|
| 2025 | $6,297 | $33,212 | $8,928 | $24,284 |
| 2024 | $6,297 | $31,351 | $8,175 | $23,176 |
| 2023 | $5,944 | $29,593 | $7,923 | $21,670 |
| 2022 | $5,579 | $40,680 | $12,000 | $28,680 |
| 2021 | $5,881 | $39,360 | $12,000 | $27,360 |
| 2020 | $5,858 | $37,800 | $12,000 | $25,800 |
| 2019 | $5,465 | $40,860 | $12,000 | $28,860 |
| 2018 | $5,027 | $24,661 | $7,981 | $16,680 |
| 2017 | $4,448 | $23,288 | $8,838 | $14,450 |
| 2016 | $4,346 | $23,288 | $8,838 | $14,450 |
| 2015 | $2,430 | $23,064 | $11,770 | $11,294 |
| 2014 | $2,430 | $21,772 | $12,522 | $9,250 |
Source: Public Records
Map
Nearby Homes