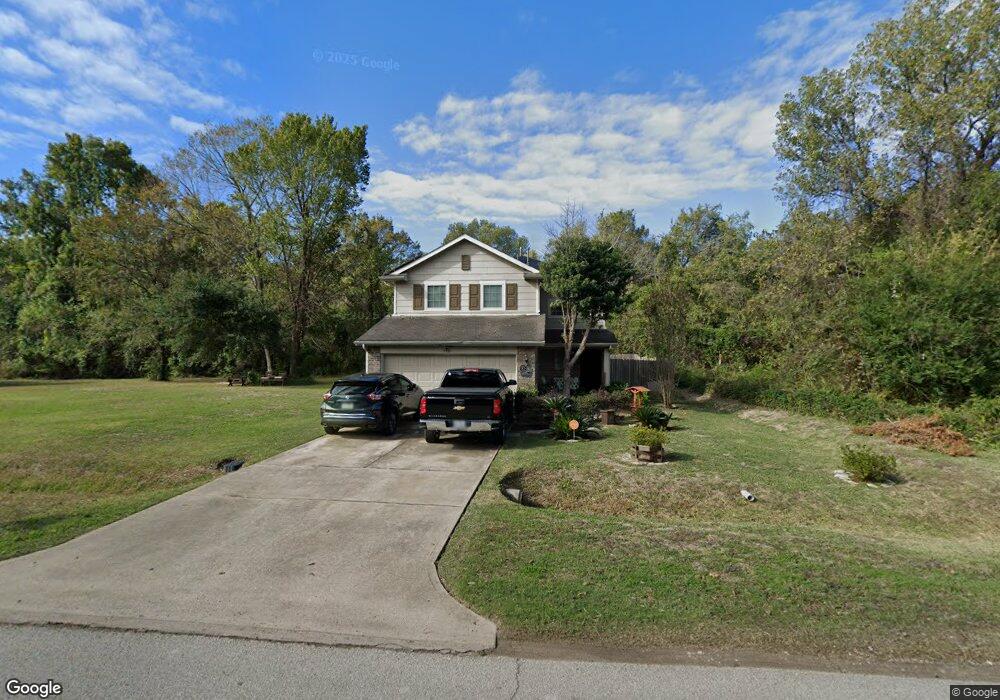
7939 Sunnyhill St Houston, TX 77088
Greater Inwood NeighborhoodEstimated Value: $265,650 - $291,000
4
Beds
3
Baths
1,567
Sq Ft
$178/Sq Ft
Est. Value
About This Home
This home is located at 7939 Sunnyhill St, Houston, TX 77088 and is currently estimated at $279,413, approximately $178 per square foot. 7939 Sunnyhill St is a home located in Harris County with nearby schools including Reece Academy, Anderson Academy, and Houston Academy.
Ownership History
Date
Name
Owned For
Owner Type
Purchase Details
Closed on
Feb 18, 2010
Sold by
Chesmar Homes Ltd
Bought by
London Carl W
Current Estimated Value
Home Financials for this Owner
Home Financials are based on the most recent Mortgage that was taken out on this home.
Original Mortgage
$102,513
Outstanding Balance
$70,244
Interest Rate
5.75%
Mortgage Type
FHA
Estimated Equity
$209,169
Purchase Details
Closed on
Mar 10, 2009
Sold by
Land Assemblage Redevelopment Authority
Bought by
Chesmar Homes Ltd
Home Financials for this Owner
Home Financials are based on the most recent Mortgage that was taken out on this home.
Original Mortgage
$15,000,000
Interest Rate
5.36%
Mortgage Type
Purchase Money Mortgage
Purchase Details
Closed on
Oct 8, 2007
Sold by
Hunt P C
Bought by
Land Assemblage Redevelopment Authority
Purchase Details
Closed on
May 1, 2007
Sold by
Russell S S and Russell Mason D
Bought by
Land Assemblage Redevelopment Authority
Create a Home Valuation Report for This Property
The Home Valuation Report is an in-depth analysis detailing your home's value as well as a comparison with similar homes in the area
Home Values in the Area
Average Home Value in this Area
Purchase History
| Date | Buyer | Sale Price | Title Company |
|---|---|---|---|
| London Carl W | -- | Celebrity Title | |
| Chesmar Homes Ltd | -- | Multiple | |
| Land Assemblage Redevelopment Authority | $800 | None Available | |
| Land Assemblage Redevelopment Authority | $3,000 | None Available |
Source: Public Records
Mortgage History
| Date | Status | Borrower | Loan Amount |
|---|---|---|---|
| Open | London Carl W | $102,513 | |
| Previous Owner | Chesmar Homes Ltd | $15,000,000 |
Source: Public Records
Tax History Compared to Growth
Tax History
| Year | Tax Paid | Tax Assessment Tax Assessment Total Assessment is a certain percentage of the fair market value that is determined by local assessors to be the total taxable value of land and additions on the property. | Land | Improvement |
|---|---|---|---|---|
| 2025 | $2,132 | $252,713 | $69,026 | $183,687 |
| 2024 | $2,132 | $290,372 | $69,026 | $221,346 |
| 2023 | $2,132 | $253,704 | $69,026 | $184,678 |
| 2022 | $3,084 | $181,725 | $38,500 | $143,225 |
| 2021 | $2,936 | $130,996 | $22,000 | $108,996 |
| 2020 | $2,805 | $117,040 | $13,750 | $103,290 |
| 2019 | $2,673 | $106,114 | $1,650 | $104,464 |
| 2018 | $2,609 | $96,600 | $1,650 | $94,950 |
| 2017 | $2,563 | $96,600 | $1,650 | $94,950 |
| 2016 | $2,563 | $96,600 | $1,650 | $94,950 |
| 2015 | $1,049 | $96,600 | $1,650 | $94,950 |
| 2014 | $1,049 | $96,600 | $1,650 | $94,950 |
Source: Public Records
Map
Nearby Homes
- 7903 Sunnyhill St
- 8015 Venus St Unit A/B
- 8101 Venus St Unit A/B
- 7926 Easter St
- 8010 Easter St
- 8210 Venus St
- 3414 Lemon Tree Ln
- 8303 Venus St
- 3306 Elmcrest Dr
- 8337 Sunnyhill St
- 00 Observatory St
- 7726 Ashmole Ln
- 8421 Venus St Unit A B
- 8112 Carver Rd
- 3522 Almington Ln
- 5815 Morehouse Ln
- 2819 Rigel Rd
- 3503 Cherry Forest Dr
- 7413 Easter St
- 7610 Alperton Dr
- 7939 Sunnyhill St
- 7935 Sunnyhill St
- 7925 Sunnyhill St
- 8011 Sunnyhill St
- 7907 Sunnyhill St
- 7930 Garfield St
- 8015 Sunnyhill St
- 7912 Zume St
- 8019 Sunnyhill St
- 2630 Garfield St
- 7912 Sunnyhill St
- 8023 Sunnyhill St
- 8023 Sunnyhill St
- 8027 Sunnyhill St
- 8015 Venus St
- 8320 Sunnyhill St
- 8219 Venus St
- 8313 Venus St
- 8035 Sunnyhill St
- 8032 Sunnyhill St