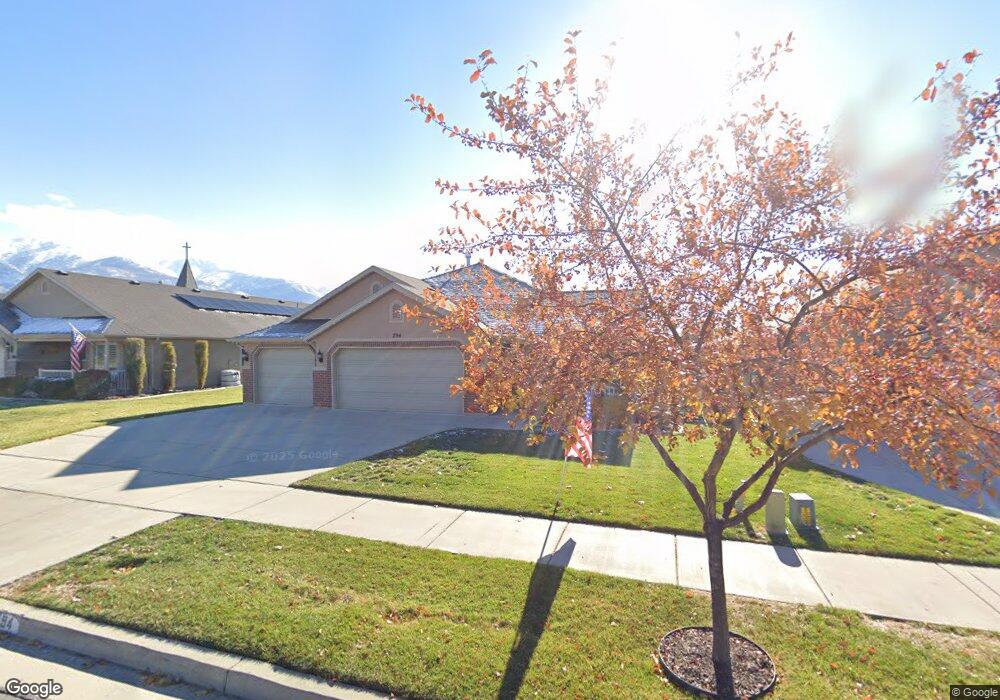
794 E 200 S Layton, UT 84041
Estimated Value: $531,000 - $611,000
3
Beds
2
Baths
2,098
Sq Ft
$275/Sq Ft
Est. Value
About This Home
This home is located at 794 E 200 S, Layton, UT 84041 and is currently estimated at $576,048, approximately $274 per square foot. 794 E 200 S is a home with nearby schools including Whitesides Elementary School, Fairfield Junior High School, and Layton High School.
Ownership History
Date
Name
Owned For
Owner Type
Purchase Details
Closed on
May 2, 2024
Sold by
Ericksen Gloria
Bought by
Gloria Ericksen Irrevocable Trust and Ericksen
Current Estimated Value
Purchase Details
Closed on
Sep 17, 2012
Sold by
Ovation Homes Llc
Bought by
Ericksen Kenneth L and Ericksen Gloria
Home Financials for this Owner
Home Financials are based on the most recent Mortgage that was taken out on this home.
Original Mortgage
$434,059
Interest Rate
3.55%
Mortgage Type
Reverse Mortgage Home Equity Conversion Mortgage
Purchase Details
Closed on
Apr 27, 2012
Sold by
Colonial Builders Group Llc
Bought by
Ovation Homes Llc
Home Financials for this Owner
Home Financials are based on the most recent Mortgage that was taken out on this home.
Original Mortgage
$198,765
Interest Rate
3.9%
Mortgage Type
Construction
Create a Home Valuation Report for This Property
The Home Valuation Report is an in-depth analysis detailing your home's value as well as a comparison with similar homes in the area
Home Values in the Area
Average Home Value in this Area
Purchase History
| Date | Buyer | Sale Price | Title Company |
|---|---|---|---|
| Gloria Ericksen Irrevocable Trust | -- | None Listed On Document | |
| Ericksen Kenneth L | -- | Lincoln Title Insura | |
| Ovation Homes Llc | -- | Lincoln Title Insura |
Source: Public Records
Mortgage History
| Date | Status | Borrower | Loan Amount |
|---|---|---|---|
| Previous Owner | Ericksen Kenneth L | $434,059 | |
| Previous Owner | Ovation Homes Llc | $198,765 |
Source: Public Records
Tax History
| Year | Tax Paid | Tax Assessment Tax Assessment Total Assessment is a certain percentage of the fair market value that is determined by local assessors to be the total taxable value of land and additions on the property. | Land | Improvement |
|---|---|---|---|---|
| 2025 | $401 | $311,300 | $97,605 | $213,695 |
| 2024 | $341 | $301,400 | $113,989 | $187,411 |
| 2023 | $2,774 | $517,000 | $137,944 | $379,056 |
| 2022 | $2,934 | $297,000 | $72,207 | $224,793 |
| 2021 | $467 | $402,000 | $99,389 | $302,611 |
| 2020 | $2,444 | $354,000 | $84,423 | $269,577 |
| 2019 | $2,411 | $342,000 | $80,913 | $261,087 |
| 2018 | $2,170 | $309,000 | $80,913 | $228,087 |
| 2016 | $277 | $171,050 | $25,334 | $145,716 |
| 2015 | $2,279 | $158,950 | $25,334 | $133,616 |
| 2014 | $189 | $149,515 | $25,334 | $124,181 |
| 2013 | -- | $143,160 | $21,162 | $121,998 |
Source: Public Records
Map
Nearby Homes
- 9 Colonial Ave
- 617 E 405 S
- 86 Mill Rd
- 389 Morgan St
- 1137 Holmes Creek Ln
- 149 N Fort Ln Unit 1D
- 504 E Alice Way
- 464 E Alice Way
- 187 N Talbot Dr
- 679 S Clearwater Falls Dr
- 706 S 600 E
- 189 S Main St Unit 76
- 189 S Main St Unit 21
- 772 N Crimson Ln
- 753 S 300 E
- 282 E 925 S
- 1368 E 275 S
- 811 S Main St
- 680 N Main St Trlr E-11
- 623 E Clearwater Dr Unit 15
Your Personal Tour Guide
Ask me questions while you tour the home.