Estimated Value: $483,000 - $533,000
4
Beds
2
Baths
1,040
Sq Ft
$491/Sq Ft
Est. Value
About This Home
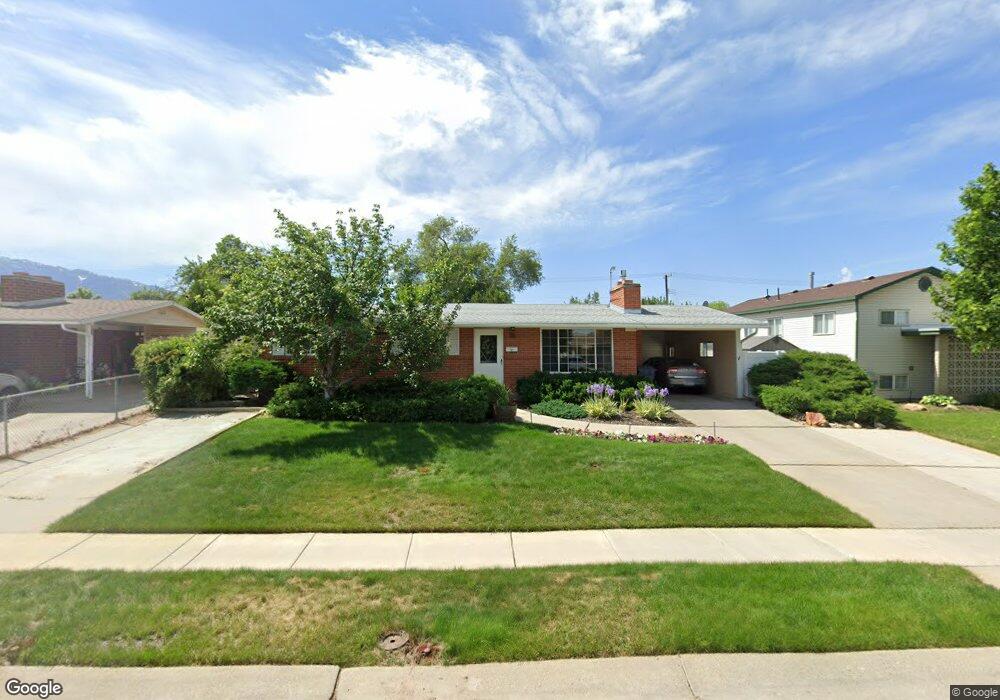
This home is located at 794 E 8375 S, Sandy, UT 84094 and is currently estimated at $510,374, approximately $490 per square foot. 794 E 8375 S is a home located in Salt Lake County with nearby schools including East Sandy School, Union Middle School, and Hillcrest High School.
Ownership History
Date
Name
Owned For
Owner Type
Purchase Details
Closed on
Dec 30, 2019
Sold by
James Mattinson W and James Ellen L
Bought by
James Mattinson Craig and James W
Current Estimated Value
Purchase Details
Closed on
Jun 27, 2006
Sold by
Guzman Efrey
Bought by
Guzman Efrey
Purchase Details
Closed on
Apr 9, 2003
Sold by
Vanderlinden Clinton Roy and Vanderlinden Megan
Bought by
Guzman Efrey
Home Financials for this Owner
Home Financials are based on the most recent Mortgage that was taken out on this home.
Original Mortgage
$141,550
Outstanding Balance
$70,046
Interest Rate
7.85%
Estimated Equity
$440,328
Create a Home Valuation Report for This Property
The Home Valuation Report is an in-depth analysis detailing your home's value as well as a comparison with similar homes in the area
Home Values in the Area
Average Home Value in this Area
Purchase History
| Date | Buyer | Sale Price | Title Company |
|---|---|---|---|
| James Mattinson Craig | -- | None Available | |
| Guzman Efrey | -- | None Available | |
| Guzman Efrey | -- | Title West |
Source: Public Records
Mortgage History
| Date | Status | Borrower | Loan Amount |
|---|---|---|---|
| Open | Guzman Efrey | $141,550 |
Source: Public Records
Tax History
| Year | Tax Paid | Tax Assessment Tax Assessment Total Assessment is a certain percentage of the fair market value that is determined by local assessors to be the total taxable value of land and additions on the property. | Land | Improvement |
|---|---|---|---|---|
| 2025 | $2,439 | $446,500 | $166,600 | $279,900 |
| 2024 | $2,439 | $450,500 | $160,200 | $290,300 |
| 2023 | $2,414 | $444,600 | $152,200 | $292,400 |
| 2022 | $2,395 | $431,400 | $149,300 | $282,100 |
| 2021 | $2,014 | $308,200 | $116,000 | $192,200 |
| 2020 | $1,940 | $280,200 | $116,000 | $164,200 |
| 2019 | $1,879 | $264,300 | $109,500 | $154,800 |
| 2016 | $1,593 | $215,600 | $109,500 | $106,100 |
Source: Public Records
Map
Nearby Homes
- 8390 S 745 E
- 744 E 8425 S
- 8268 S 865 E
- 635 Pioneer Ave
- 8322 S Levine Ln Unit 111
- 991 Merewood Ct
- 760 E 8080 S
- 627 E 8680 S
- 8722 S Oakwood Park Cir Unit 8722
- 8732 S Oakwood Park Cr
- 8087 S 615 E
- 8797 Green Way Unit 3
- 8732 S 620 E
- 8373 S 1100 E Unit 39
- 8485 S Harvard Park Dr
- 8583 S Harvard Park Dr
- 359 E 8400 S
- 608 E 8800 S
- 8459 S 300 E
- 8569 Round Stone Cove
Your Personal Tour Guide
Ask me questions while you tour the home.