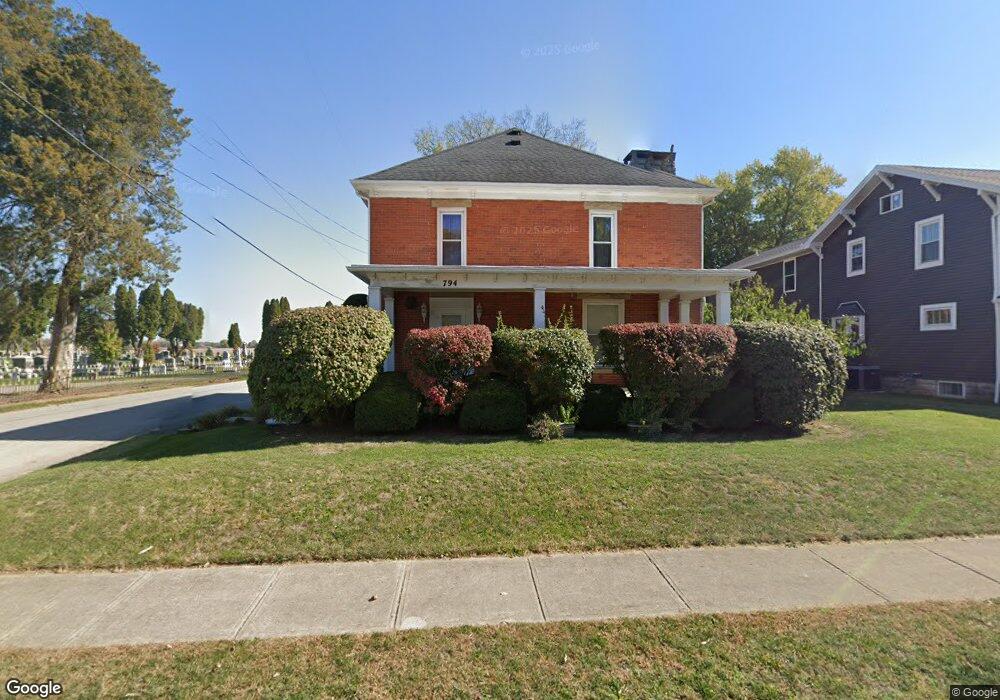
794 N High St Covington, OH 45318
Estimated Value: $230,720 - $246,000
2
Beds
2
Baths
2,144
Sq Ft
$111/Sq Ft
Est. Value
About This Home
This home is located at 794 N High St, Covington, OH 45318 and is currently estimated at $238,680, approximately $111 per square foot. 794 N High St is a home located in Miami County with nearby schools including Covington Elementary/Junior High School, Covington Junior High School, and Covington High School.
Ownership History
Date
Name
Owned For
Owner Type
Purchase Details
Closed on
Jan 31, 2019
Sold by
Langston Sally R
Bought by
Cook Gary D and Cook Linda M
Current Estimated Value
Home Financials for this Owner
Home Financials are based on the most recent Mortgage that was taken out on this home.
Original Mortgage
$126,562
Outstanding Balance
$111,271
Interest Rate
4.5%
Mortgage Type
VA
Estimated Equity
$127,409
Purchase Details
Closed on
Jan 1, 1990
Bought by
Langston Keith H
Create a Home Valuation Report for This Property
The Home Valuation Report is an in-depth analysis detailing your home's value as well as a comparison with similar homes in the area
Home Values in the Area
Average Home Value in this Area
Purchase History
| Date | Buyer | Sale Price | Title Company |
|---|---|---|---|
| Cook Gary D | $143,000 | None Available | |
| Langston Keith H | -- | -- |
Source: Public Records
Mortgage History
| Date | Status | Borrower | Loan Amount |
|---|---|---|---|
| Open | Cook Gary D | $126,562 |
Source: Public Records
Tax History Compared to Growth
Tax History
| Year | Tax Paid | Tax Assessment Tax Assessment Total Assessment is a certain percentage of the fair market value that is determined by local assessors to be the total taxable value of land and additions on the property. | Land | Improvement |
|---|---|---|---|---|
| 2024 | $1,617 | $52,750 | $13,510 | $39,240 |
| 2023 | $1,617 | $52,750 | $13,510 | $39,240 |
| 2022 | $1,650 | $52,750 | $13,510 | $39,240 |
| 2021 | $1,291 | $40,570 | $10,400 | $30,170 |
| 2020 | $1,294 | $40,570 | $10,400 | $30,170 |
| 2019 | $1,300 | $40,570 | $10,400 | $30,170 |
| 2018 | $1,057 | $34,510 | $8,120 | $26,390 |
| 2017 | $1,076 | $34,510 | $8,120 | $26,390 |
| 2016 | $1,062 | $34,510 | $8,120 | $26,390 |
| 2015 | $967 | $33,190 | $7,810 | $25,380 |
| 2014 | $967 | $33,190 | $7,810 | $25,380 |
| 2013 | $932 | $33,190 | $7,810 | $25,380 |
Source: Public Records
Map
Nearby Homes
- 731 N Pearl St
- 520 N Pearl St
- 501 N Main St Unit C1
- 133 W Broadway St
- 698 E Broadway St
- 124 N Main St
- 271 N Ludlow St
- 00 W Piqua Clay Rd
- 223 Henry Ct
- 221 S High St
- 536 S High St
- 5225 N Front St
- 8341 W Covington Gettysburg Rd
- 206 Charles Ct
- 204 Charles Ct
- 210 Charles Ct
- 208 Charles Ct
- 212 Charles Ct
- 202 Charles Ct
- 205 Charles Ct