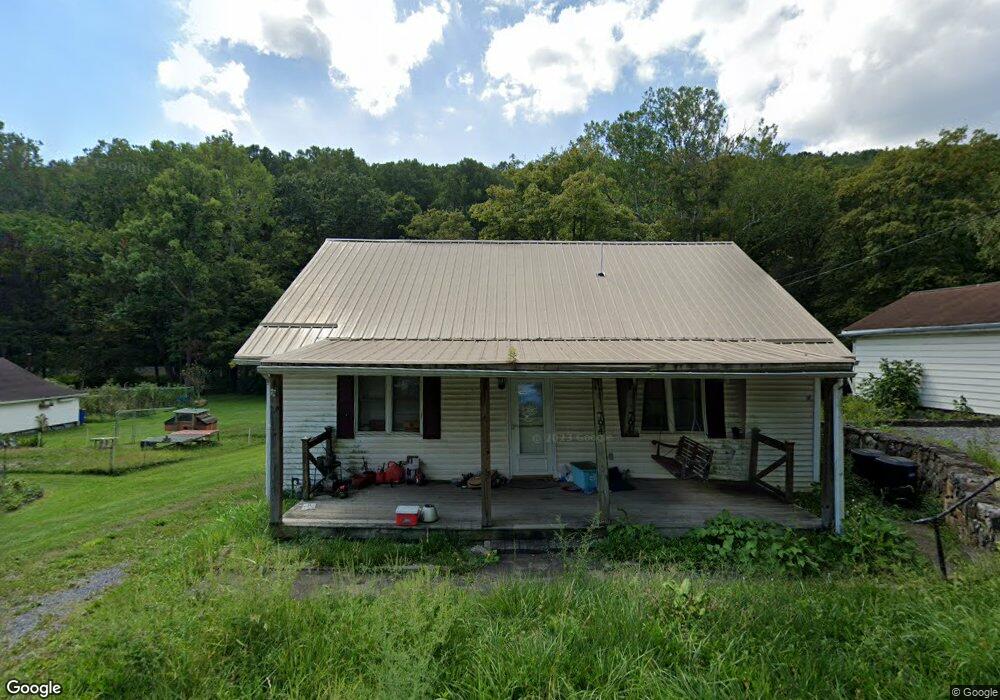
794 Paw Paw Creek Rd Fairview, WV 26570
Estimated Value: $95,000 - $157,097
3
Beds
2
Baths
1,470
Sq Ft
$92/Sq Ft
Est. Value
About This Home
This home is located at 794 Paw Paw Creek Rd, Fairview, WV 26570 and is currently estimated at $135,524, approximately $92 per square foot. 794 Paw Paw Creek Rd is a home with nearby schools including Fairview Elementary School and North Marion High School.
Ownership History
Date
Name
Owned For
Owner Type
Purchase Details
Closed on
Mar 4, 2021
Sold by
Menas Tyler and Menas Mariah
Bought by
Case Ty K and Case Jessica B
Current Estimated Value
Home Financials for this Owner
Home Financials are based on the most recent Mortgage that was taken out on this home.
Original Mortgage
$116,844
Interest Rate
3.1%
Mortgage Type
FHA
Purchase Details
Closed on
May 7, 2018
Sold by
Harter Andrew S and Harter Roberta A
Bought by
Menas Tyler and Menas Mariah
Home Financials for this Owner
Home Financials are based on the most recent Mortgage that was taken out on this home.
Original Mortgage
$87,300
Interest Rate
4.4%
Mortgage Type
New Conventional
Purchase Details
Closed on
Feb 12, 2007
Sold by
Plaugher Stanford L and Plaugher Barbara A
Bought by
Tejchman Roberta A
Home Financials for this Owner
Home Financials are based on the most recent Mortgage that was taken out on this home.
Original Mortgage
$89,795
Interest Rate
6.4%
Mortgage Type
New Conventional
Create a Home Valuation Report for This Property
The Home Valuation Report is an in-depth analysis detailing your home's value as well as a comparison with similar homes in the area
Home Values in the Area
Average Home Value in this Area
Purchase History
| Date | Buyer | Sale Price | Title Company |
|---|---|---|---|
| Case Ty K | $119,000 | None Available | |
| Menas Tyler | $90,000 | None Available | |
| Tejchman Roberta A | $87,550 | -- |
Source: Public Records
Mortgage History
| Date | Status | Borrower | Loan Amount |
|---|---|---|---|
| Previous Owner | Case Ty K | $116,844 | |
| Previous Owner | Menas Tyler | $87,300 | |
| Previous Owner | Tejchman Roberta A | $89,795 |
Source: Public Records
Tax History Compared to Growth
Tax History
| Year | Tax Paid | Tax Assessment Tax Assessment Total Assessment is a certain percentage of the fair market value that is determined by local assessors to be the total taxable value of land and additions on the property. | Land | Improvement |
|---|---|---|---|---|
| 2024 | $879 | $68,520 | $17,280 | $51,240 |
| 2023 | $843 | $66,360 | $17,280 | $49,080 |
| 2022 | $852 | $68,820 | $17,280 | $51,540 |
| 2021 | $753 | $61,620 | $17,040 | $44,580 |
| 2020 | $736 | $59,880 | $17,460 | $42,420 |
| 2019 | $732 | $58,560 | $18,540 | $40,020 |
| 2018 | $814 | $65,580 | $23,520 | $42,060 |
| 2017 | $781 | $63,540 | $21,600 | $41,940 |
| 2016 | $748 | $61,080 | $21,360 | $39,720 |
| 2015 | $733 | $59,820 | $21,360 | $38,460 |
| 2014 | $733 | $59,340 | $21,360 | $37,980 |
Source: Public Records
Map
Nearby Homes
- TBD Fairview Rd
- 17 Hannah Ln
- 339 Paw Creek Rd
- 1300 Paw Creek Rd
- 106 Madison St
- TBD Rush Run Rd
- 417 Main St
- TBD Daybrook Rd
- Lot 2 Jesse's Run Rd
- 2040 Monumental Rd
- Rd Unit Lot WP001
- 95 James Fork Rd
- 90 View Ave
- 408 Church St
- 211 Main St
- 1789 McCurdysville Pike
- 233 K St
- Tbd Fairview Rd
- 3420 Central Ave
- 57 Chatham Hill
- 806 Paw Paw Creek Rd
- 802 Paw Paw Creek Rd
- 803 Paw Paw Creek Rd
- 820 Paw Paw Creek Rd
- 820 Paw Creek Rd
- 817 Paw Paw Creek Rd
- 830 Paw Paw Creek Rd
- 801 Paw Creek Rd
- 32 Laurel Run Rd
- 44 Laurel Run Rd
- 875 Paw Paw Creek Rd
- 91 Laurel Run Rd
- 659 Paw Paw Creek Rd
- 667 Paw Paw Creek Rd
- 654 Paw Paw Creek Rd
- 170 Laurel Run Rd
- 55 Knotts Run Rd
- 181 Primrose Dr
- 997 Paw Paw Creek Rd
- 584 Paw Paw Creek Rd