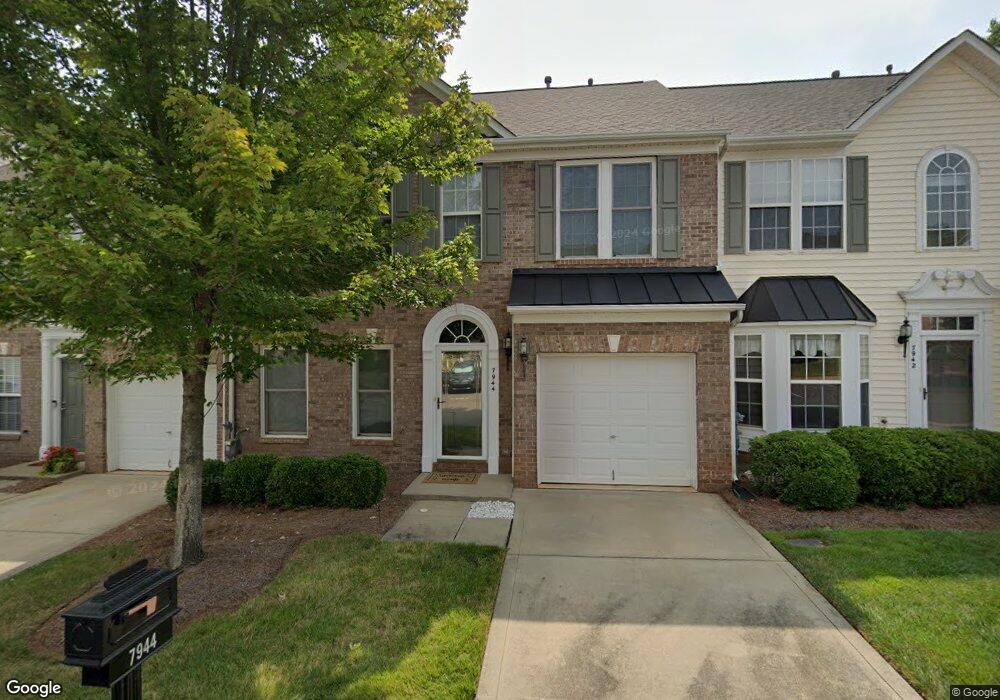
7944 Mariners Pointe Cir Unit 24 Denver, NC 28037
Estimated Value: $304,000 - $344,000
3
Beds
3
Baths
1,921
Sq Ft
$170/Sq Ft
Est. Value
About This Home
This home is located at 7944 Mariners Pointe Cir Unit 24, Denver, NC 28037 and is currently estimated at $325,720, approximately $169 per square foot. 7944 Mariners Pointe Cir Unit 24 is a home located in Lincoln County with nearby schools including St. James Elementary School, East Lincoln Middle School, and East Lincoln High School.
Ownership History
Date
Name
Owned For
Owner Type
Purchase Details
Closed on
Mar 25, 2019
Sold by
Robinson Brittany Nicole and Phillips Chad A
Bought by
Mccraw Dayne L
Current Estimated Value
Home Financials for this Owner
Home Financials are based on the most recent Mortgage that was taken out on this home.
Original Mortgage
$187,200
Outstanding Balance
$164,581
Interest Rate
4.4%
Mortgage Type
New Conventional
Estimated Equity
$161,139
Purchase Details
Closed on
Dec 30, 2015
Sold by
Hinton Carrie V
Bought by
Robinson Brittany Nicole
Home Financials for this Owner
Home Financials are based on the most recent Mortgage that was taken out on this home.
Original Mortgage
$132,300
Interest Rate
3.96%
Mortgage Type
New Conventional
Purchase Details
Closed on
Dec 30, 2004
Bought by
Hinton Carrie
Purchase Details
Closed on
Aug 27, 2004
Bought by
Nvr Inc
Purchase Details
Closed on
Mar 31, 2004
Bought by
Burke & Associates Llc
Create a Home Valuation Report for This Property
The Home Valuation Report is an in-depth analysis detailing your home's value as well as a comparison with similar homes in the area
Home Values in the Area
Average Home Value in this Area
Purchase History
| Date | Buyer | Sale Price | Title Company |
|---|---|---|---|
| Mccraw Dayne L | $210,000 | None Available | |
| Robinson Brittany Nicole | $147,000 | None Available | |
| Hinton Carrie | $139,000 | -- | |
| Nvr Inc | $156,000 | -- | |
| Burke & Associates Llc | $750,000 | -- |
Source: Public Records
Mortgage History
| Date | Status | Borrower | Loan Amount |
|---|---|---|---|
| Open | Mccraw Dayne L | $187,200 | |
| Previous Owner | Robinson Brittany Nicole | $132,300 |
Source: Public Records
Tax History Compared to Growth
Tax History
| Year | Tax Paid | Tax Assessment Tax Assessment Total Assessment is a certain percentage of the fair market value that is determined by local assessors to be the total taxable value of land and additions on the property. | Land | Improvement |
|---|---|---|---|---|
| 2025 | $2,035 | $313,702 | $37,000 | $276,702 |
| 2024 | $2,007 | $313,702 | $37,000 | $276,702 |
| 2023 | $2,002 | $313,702 | $37,000 | $276,702 |
| 2022 | $1,486 | $185,476 | $30,000 | $155,476 |
| 2021 | $1,495 | $185,476 | $30,000 | $155,476 |
| 2020 | $1,293 | $185,476 | $30,000 | $155,476 |
| 2019 | $1,293 | $185,476 | $30,000 | $155,476 |
| 2018 | $1,104 | $143,281 | $23,500 | $119,781 |
| 2017 | $1,003 | $143,281 | $23,500 | $119,781 |
| 2016 | $999 | $143,281 | $23,500 | $119,781 |
| 2015 | $1,109 | $143,281 | $23,500 | $119,781 |
| 2014 | $1,085 | $146,175 | $20,000 | $126,175 |
Source: Public Records
Map
Nearby Homes
- 7943 Mariners Pointe Cir
- 2656 Norman Isle Dr
- 1515 N Nc 16 Business Hwy
- 4266 Sylvan Pond Ct
- 4279 Sylvan Pond Ct
- 7903 Smith Pond Dr
- 7958 Unity Church Rd
- 7184 Indigo Way
- Lot 10 Green Point Ct
- 2325 Perry Rd
- 6859 Lakecrest Ct
- 6873 Lakecrest Ct
- 1751 Knights Dr
- 8079 Optimist Club Rd
- 8260 Graham Rd
- 1925 Cameron Heights Cir
- 7708 W Berkeley Rd
- 00 Lake Shore Rd S
- 6038 Durango Way
- 1150 Golden Hill Ln
- 7944 Mariners Pointe Cir
- 7944 Mariners Pointe Cir Unit D
- 7942 Mariners Pointe Cir
- 7942 Mariners Pointe Cir Unit 5C
- 7946 Mariners Pointe Cir
- 7948 Mariners Pointe Cir
- 7940 Mariners Pointe Cir
- 7940 Mariners Pointe Cir Unit F
- 7950 Mariners Pointe Cir
- 7950 Mariners Pointe Cir Unit 5A
- 7938 Mariners Pointe Cir
- 7938 Mariners Pointe Cir Unit 21
- 7943 Mariners Pointe Cir Unit 79
- 7954 Mariners Pointe Cir Unit One
- 7954 Mariners Pointe Cir
- 7936 Mariners Pointe Cir
- 7936 Mariners Pointe Cir Unit 20
- 7941 Mariners Pointe Cir
- 7934 Mariners Pointe Cir
- 7934 Mariners Pointe Cir Unit U19