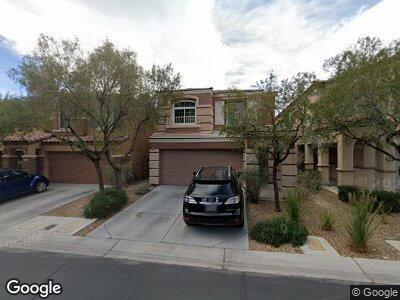
7947 Capistrano Valley Ave Unit 2 Las Vegas, NV 89178
Mountains Edge NeighborhoodEstimated Value: $401,000 - $432,000
3
Beds
3
Baths
1,569
Sq Ft
$265/Sq Ft
Est. Value
About This Home
This home is located at 7947 Capistrano Valley Ave Unit 2, Las Vegas, NV 89178 and is currently estimated at $415,280, approximately $264 per square foot. 7947 Capistrano Valley Ave Unit 2 is a home located in Clark County with nearby schools including Carolyn S. Reedom Elementary School, Desert Oasis High School, and Doral Academy Cactus.
Ownership History
Date
Name
Owned For
Owner Type
Purchase Details
Closed on
Oct 24, 2011
Sold by
Fannie Mae
Bought by
Turner Paul W
Current Estimated Value
Home Financials for this Owner
Home Financials are based on the most recent Mortgage that was taken out on this home.
Original Mortgage
$87,840
Outstanding Balance
$60,958
Interest Rate
4.01%
Mortgage Type
New Conventional
Estimated Equity
$362,696
Purchase Details
Closed on
Jul 6, 2011
Sold by
Aguilar Antonio and Aguilar Adriana
Bought by
Federal National Mortgage Association
Purchase Details
Closed on
Jan 11, 2008
Sold by
Woodside Rio Vista Llc
Bought by
Aguilar Antonio and Aguilar Adriana
Home Financials for this Owner
Home Financials are based on the most recent Mortgage that was taken out on this home.
Original Mortgage
$206,970
Interest Rate
6.07%
Mortgage Type
Unknown
Create a Home Valuation Report for This Property
The Home Valuation Report is an in-depth analysis detailing your home's value as well as a comparison with similar homes in the area
Home Values in the Area
Average Home Value in this Area
Purchase History
| Date | Buyer | Sale Price | Title Company |
|---|---|---|---|
| Turner Paul W | $109,800 | Lawyers Title Of Nevada Cha | |
| Federal National Mortgage Association | $172,687 | Accommodation | |
| Aguilar Antonio | $218,120 | Chicago Title |
Source: Public Records
Mortgage History
| Date | Status | Borrower | Loan Amount |
|---|---|---|---|
| Open | Turner Paul W | $87,840 | |
| Previous Owner | Aguilar Antonio | $206,970 |
Source: Public Records
Tax History Compared to Growth
Tax History
| Year | Tax Paid | Tax Assessment Tax Assessment Total Assessment is a certain percentage of the fair market value that is determined by local assessors to be the total taxable value of land and additions on the property. | Land | Improvement |
|---|---|---|---|---|
| 2025 | $1,578 | $110,503 | $35,000 | $75,503 |
| 2024 | $1,532 | $110,503 | $35,000 | $75,503 |
| 2023 | $1,532 | $102,710 | $31,500 | $71,210 |
| 2022 | $1,488 | $91,105 | $26,250 | $64,855 |
| 2021 | $1,445 | $86,090 | $24,500 | $61,590 |
| 2020 | $1,399 | $84,259 | $23,450 | $60,809 |
| 2019 | $1,359 | $80,716 | $21,000 | $59,716 |
| 2018 | $1,335 | $73,764 | $16,450 | $57,314 |
| 2017 | $1,960 | $66,834 | $15,050 | $51,784 |
| 2016 | $1,299 | $58,069 | $11,550 | $46,519 |
| 2015 | $1,200 | $54,867 | $9,100 | $45,767 |
| 2014 | $1,163 | $38,462 | $5,600 | $32,862 |
Source: Public Records
Map
Nearby Homes
- 7929 Valladolid Ave
- 7961 Alta Lima Valley Ct
- 7931 Campers Village Ave
- 9893 Cove Haven Ct
- 9986 Sand Key St
- 10051 Sand Key St
- 9981 Sable Point St
- 10067 Sand Key St
- 10091 Sand Key St
- 9996 Sable Point St
- 10025 San Floriano Ave
- 7878 Brianna Cheerful Ave
- 10081 Peak Lookout St
- 8159 Base Camp Ave
- 10002 Trapper Mountain St
- 8156 Cheerful Valley Ave
- 8244 Cupertino Heights Way
- 8070 Pavarotti Ave
- 8267 Campbell Springs Ave
- 9611 Trattoria St
- 7947 Capistrano Valley Ave Unit 2
- 7951 Capistrano Valley Ave
- 7943 Capistrano Valley Ave
- 7955 Capistrano Valley Ave
- 7939 Capistrano Valley Ave
- 7944 Alta Lima Valley Ct
- 7940 Alta Lima Valley Ct
- 7959 Capistrano Valley Ave
- 7948 Alta Lima Valley Ct
- 7935 Capistrano Valley Ave
- 7936 Alta Lima Valley Ct
- 7952 Alta Lima Valley Ct
- 7948 Capistrano Valley Ave
- 7944 Capistrano Valley Ave
- 7931 Capistrano Valley Ave
- 7956 Alta Lima Valley Ct
- 7932 Alta Lima Valley Ct
- 7963 Capistrano Valley Ave
- 7952 Capistrano Valley Ave
- 7940 Capistrano Valley Ave