79485 Mandeville Rd Bermuda Dunes, CA 92203
Bermuda Dunes Country Club NeighborhoodEstimated Value: $803,000 - $1,025,000
4
Beds
4
Baths
2,500
Sq Ft
$378/Sq Ft
Est. Value
About This Home
This home is located at 79485 Mandeville Rd, Bermuda Dunes, CA 92203 and is currently estimated at $945,496, approximately $378 per square foot. 79485 Mandeville Rd is a home located in Riverside County with nearby schools including James Monroe Elementary School, Colonel Mitchell Paige Middle School, and Palm Desert High School.
Ownership History
Date
Name
Owned For
Owner Type
Purchase Details
Closed on
Jul 28, 2021
Sold by
Minini Randy C and Minini Linda A
Bought by
Minini Randy C and Minini Linda A
Current Estimated Value
Purchase Details
Closed on
Dec 11, 2006
Sold by
Abajian James A and Abajian Gaye
Bought by
Minini Randy C and Minini Linda A
Home Financials for this Owner
Home Financials are based on the most recent Mortgage that was taken out on this home.
Original Mortgage
$560,000
Interest Rate
8.03%
Mortgage Type
Negative Amortization
Purchase Details
Closed on
Mar 26, 2003
Sold by
Charlebois John P and Charlebois Marjorie A
Bought by
Abajian James A and Abajian Gaye
Purchase Details
Closed on
Oct 27, 1998
Sold by
Charlebois John P and Marjorie Charlebois
Bought by
Charlebois John P and Charlebois Marjorie A
Create a Home Valuation Report for This Property
The Home Valuation Report is an in-depth analysis detailing your home's value as well as a comparison with similar homes in the area
Home Values in the Area
Average Home Value in this Area
Purchase History
| Date | Buyer | Sale Price | Title Company |
|---|---|---|---|
| Minini Randy C | -- | None Available | |
| Minini Randy C | $800,000 | Equity Title Company | |
| Abajian James A | $155,000 | Old Republic Title Company | |
| Charlebois John P | -- | -- |
Source: Public Records
Mortgage History
| Date | Status | Borrower | Loan Amount |
|---|---|---|---|
| Previous Owner | Minini Randy C | $560,000 |
Source: Public Records
Tax History Compared to Growth
Tax History
| Year | Tax Paid | Tax Assessment Tax Assessment Total Assessment is a certain percentage of the fair market value that is determined by local assessors to be the total taxable value of land and additions on the property. | Land | Improvement |
|---|---|---|---|---|
| 2025 | $10,970 | $916,700 | $320,845 | $595,855 |
| 2023 | $10,970 | $889,900 | $311,465 | $578,435 |
| 2022 | $12,556 | $1,019,477 | $353,492 | $665,985 |
| 2021 | $8,167 | $661,059 | $231,551 | $429,508 |
| 2020 | $7,234 | $590,232 | $206,742 | $383,490 |
| 2019 | $7,026 | $573,040 | $200,720 | $372,320 |
| 2018 | $6,759 | $551,000 | $193,000 | $358,000 |
| 2017 | $6,750 | $551,000 | $193,000 | $358,000 |
| 2016 | $6,714 | $551,000 | $193,000 | $358,000 |
| 2015 | $6,374 | $513,000 | $180,000 | $333,000 |
| 2014 | $6,389 | $513,000 | $180,000 | $333,000 |
Source: Public Records
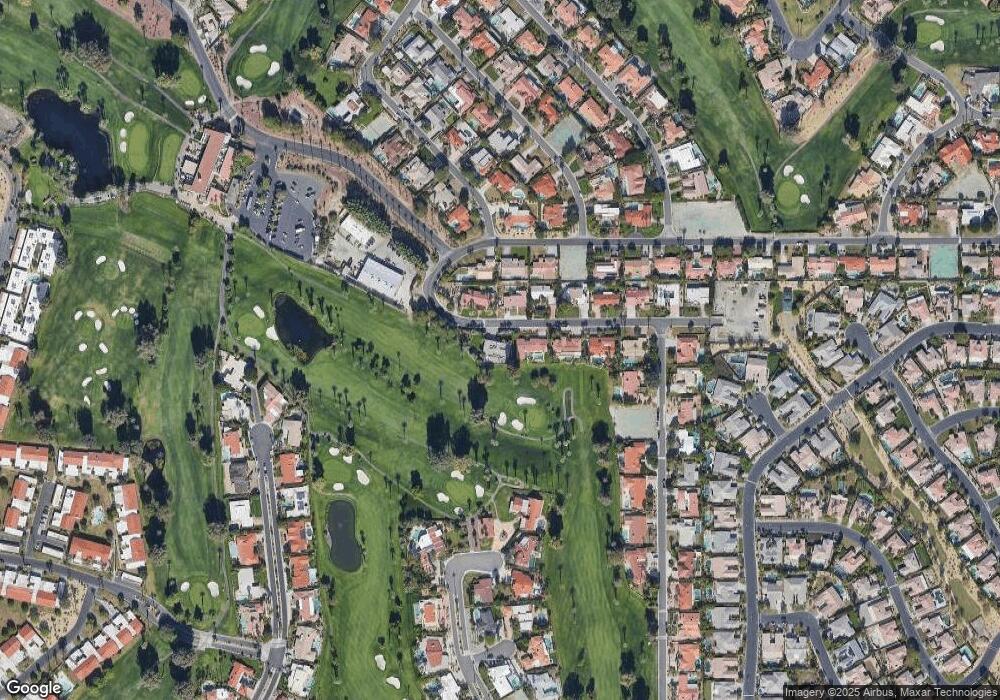
Map
Nearby Homes
- 42820 Caballeros Dr
- 42665 Buccaneer Ct
- 79422 Montego Bay Dr
- 43251 Corte Del Oro
- 79336 Montego Bay Dr
- 43651 Port Maria Rd
- 79865 Kingston Dr
- 43721 Port Maria Rd
- 42533 Capri Dr
- 79835 Parkway Esplanade N
- 43761 Chapelton Dr
- 79371 Four Paths Ln
- 43761 Port Maria Rd
- 79100 Barwick Place
- 43229 Lacovia Dr
- 79321 4 Paths Ln
- 42505 Adams St
- 43331 Lacovia Dr
- 43265 Lacovia Dr
- 43539 Corte Del Oro
- 79505 Mandeville Rd
- 79480 Mandeville Rd
- 79500 Mandeville Rd
- 79520 Mandeville Rd
- 79525 Mandeville Rd
- 79505 Kingston Dr
- 79595 Kingston Dr
- 79515 Kingston Dr
- 79540 Mandeville Rd
- 79555 Mandeville Rd
- 42945 Cerritos Dr
- 79560 Mandeville Rd
- 42980 Cerritos Dr
- 79555 Kingston Dr
- 42975 Darien Dr
- 42915 Cerritos Dr
- 79580 Mandeville Rd
- 42950 Cerritos Dr
- 43121 Port Maria Rd
- 79575 Kingston Dr