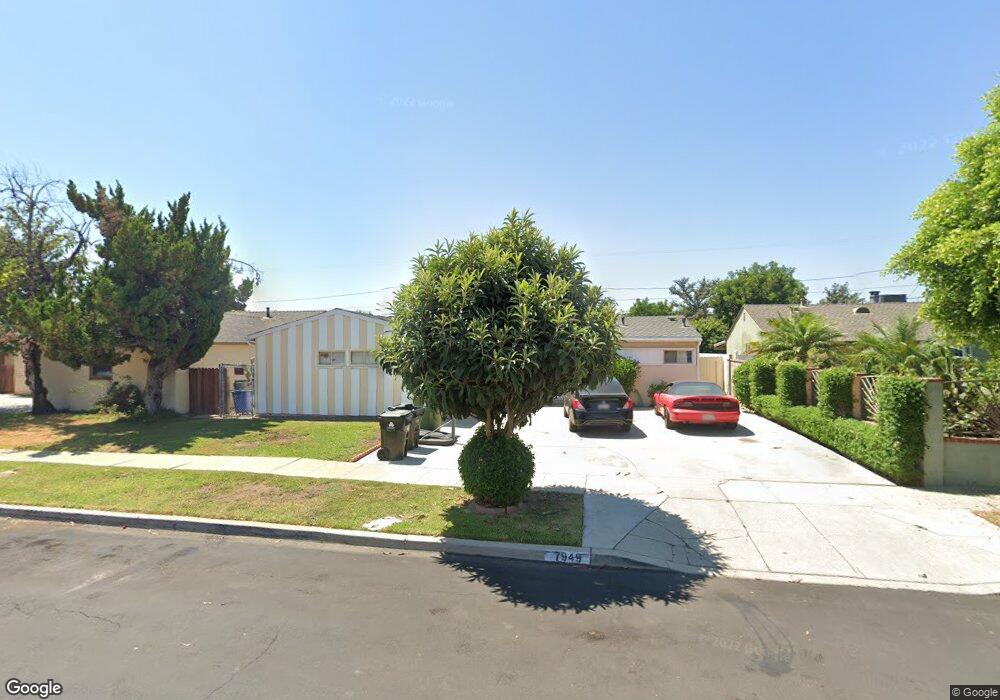
7949 Newcastle Ave Reseda, CA 91335
Estimated Value: $757,635 - $817,000
About This Home
This home is located at 7949 Newcastle Ave, Reseda, CA 91335 and is currently estimated at $779,909, approximately $649 per square foot. 7949 Newcastle Ave is a home located in Los Angeles County with nearby schools including Garden Grove Elementary School, Northridge Middle School, and Northridge Academy High.
Ownership History
We collect this data history from publicly available records. To have your information removed, we recommend requesting removal directly through your county’s website.
Purchase Details
Purchase Details
Home Financials for this Owner
Home Financials are based on the most recent Mortgage that was taken out on this home.Purchase Details
Home Financials for this Owner
Home Financials are based on the most recent Mortgage that was taken out on this home.Home Values in the Area
Average Home Value in this Area
Purchase History
We collect this data history from publicly available records. To have your information removed, we recommend requesting removal directly through your county’s website.
| Date | Buyer | Sale Price | Title Company |
|---|---|---|---|
| -- | None Listed On Document | ||
| -- | Stewart Title Co Of Ca Inc | ||
| $133,000 | Southland Title |
Mortgage History
We collect this data history from publicly available records. To have your information removed, we recommend requesting removal directly through your county’s website.
| Date | Status | Borrower | Loan Amount |
|---|---|---|---|
| Previous Owner | $261,000 | ||
| Previous Owner | $131,602 |
Tax History
We collect this data history from publicly available records. To have your information removed, we recommend requesting removal directly through your county’s website.
| Year | Tax Paid | Tax Assessment Tax Assessment Total Assessment is a certain percentage of the fair market value that is determined by local assessors to be the total taxable value of land and additions on the property. | Land | Improvement |
|---|---|---|---|---|
| 2025 | $2,823 | $212,337 | $132,036 | $80,301 |
| 2024 | $2,760 | $208,175 | $129,448 | $78,727 |
| 2023 | $2,711 | $204,094 | $126,910 | $77,184 |
| 2022 | $2,589 | $200,093 | $124,422 | $75,671 |
| 2021 | $2,554 | $196,171 | $121,983 | $74,188 |
| 2020 | $2,575 | $194,161 | $120,733 | $73,428 |
| 2019 | $2,481 | $190,355 | $118,366 | $71,989 |
| 2018 | $2,385 | $186,624 | $116,046 | $70,578 |
| 2016 | $2,269 | $179,380 | $111,541 | $67,839 |
| 2015 | $2,237 | $176,686 | $109,866 | $66,820 |
| 2014 | $2,254 | $173,226 | $107,714 | $65,512 |
Map
- 7848 Chastain Ave
- 7740 Lindley Ave
- 18229 Strathern St
- 8136 Garden Grove Ave
- 7741 Zelzah Ave
- 18027 Hatton St
- 18166 Keswick St
- 17945 Roscoe Blvd
- 8045 Darby Place
- 7719 Nestle Ave
- 18326 Elkwood St
- 18320 Ingomar St
- 8207 Yarmouth Ave
- 17926 Schoenborn St
- 17920 Schoenborn St
- 18114 Schoenborn St
- 8033 Darby Ave
- 7862 Jellico Ave
- 8207 White Oak Ave
- 17852 Saticoy St
- 7955 Newcastle Ave
- 7943 Newcastle Ave
- 7944 Hesperia Ave
- 7950 Hesperia Ave
- 7938 Hesperia Ave
- 7937 Newcastle Ave
- 7961 Newcastle Ave
- 7932 Hesperia Ave
- 7956 Hesperia Ave
- 7948 Newcastle Ave
- 7954 Newcastle Ave
- 7942 Newcastle Ave
- 7931 Newcastle Ave
- 7936 Newcastle Ave
- 7960 Newcastle Ave
- 7926 Hesperia Ave
- 7930 Newcastle Ave
- 7925 Newcastle Ave
- 8001 Newcastle Ave
- 7945 Hesperia Ave
Ask me questions while you tour the home.