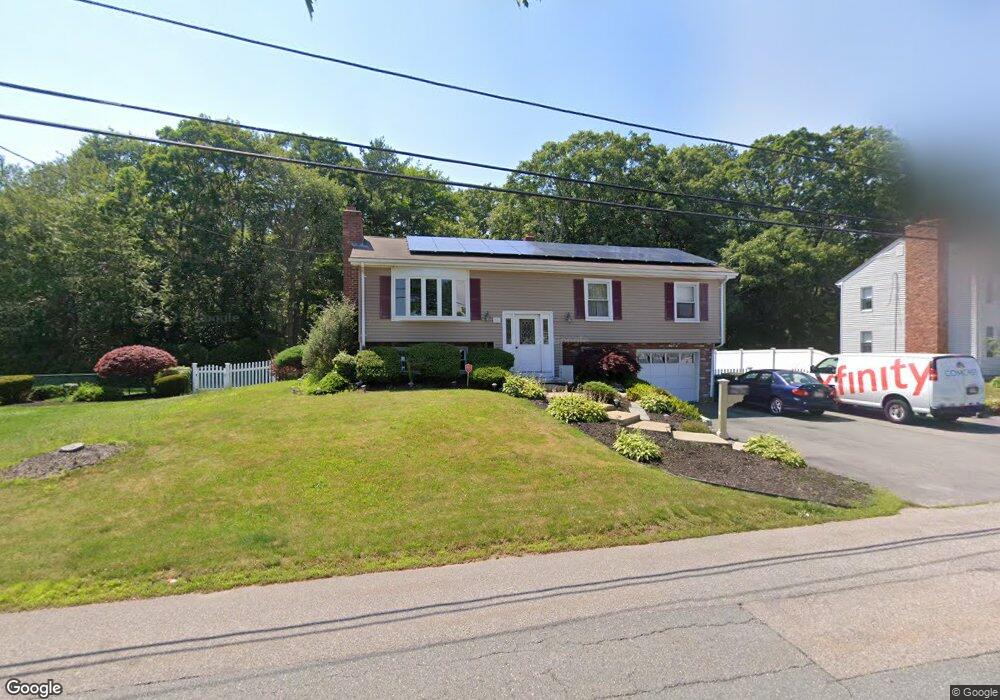
795 Almy Rd Somerset, MA 02726
Pottersville NeighborhoodEstimated Value: $383,000 - $500,000
3
Beds
2
Baths
1,144
Sq Ft
$403/Sq Ft
Est. Value
About This Home
This home is located at 795 Almy Rd, Somerset, MA 02726 and is currently estimated at $460,584, approximately $402 per square foot. 795 Almy Rd is a home located in Bristol County with nearby schools including North Elementary School, Somerset Middle School, and SCEC Life Academy.
Ownership History
Date
Name
Owned For
Owner Type
Purchase Details
Closed on
Aug 30, 2002
Sold by
Young Theresa J
Bought by
Gabus Steven G and Gabus Tracy
Current Estimated Value
Purchase Details
Closed on
Mar 11, 1994
Sold by
Marcellus Est Jerome R and Marcellus Ronald G
Bought by
Young Eric C and Young Theresa J
Create a Home Valuation Report for This Property
The Home Valuation Report is an in-depth analysis detailing your home's value as well as a comparison with similar homes in the area
Home Values in the Area
Average Home Value in this Area
Purchase History
| Date | Buyer | Sale Price | Title Company |
|---|---|---|---|
| Gabus Steven G | $227,000 | -- | |
| Gabus Steven G | $227,000 | -- | |
| Young Eric C | $120,000 | -- | |
| Young Eric C | $120,000 | -- |
Source: Public Records
Mortgage History
| Date | Status | Borrower | Loan Amount |
|---|---|---|---|
| Open | Young Eric C | $196,000 | |
| Closed | Young Eric C | $192,800 |
Source: Public Records
Tax History Compared to Growth
Tax History
| Year | Tax Paid | Tax Assessment Tax Assessment Total Assessment is a certain percentage of the fair market value that is determined by local assessors to be the total taxable value of land and additions on the property. | Land | Improvement |
|---|---|---|---|---|
| 2025 | $5,570 | $418,800 | $179,600 | $239,200 |
| 2024 | $5,235 | $409,300 | $179,600 | $229,700 |
| 2023 | $4,586 | $361,700 | $156,000 | $205,700 |
| 2022 | $4,237 | $318,800 | $134,600 | $184,200 |
| 2021 | $4,267 | $290,700 | $121,600 | $169,100 |
| 2020 | $4,254 | $279,500 | $121,700 | $157,800 |
| 2019 | $4,813 | $263,700 | $121,700 | $142,000 |
| 2018 | $4,233 | $249,600 | $117,200 | $132,400 |
| 2017 | $4,133 | $237,500 | $111,800 | $125,700 |
| 2016 | $4,159 | $237,500 | $111,800 | $125,700 |
| 2015 | $3,864 | $222,700 | $106,700 | $116,000 |
| 2014 | $5,373 | $222,500 | $103,700 | $118,800 |
Source: Public Records
Map
Nearby Homes