795 Foreman St Lowell, MI 49331
Estimated Value: $225,225 - $248,000
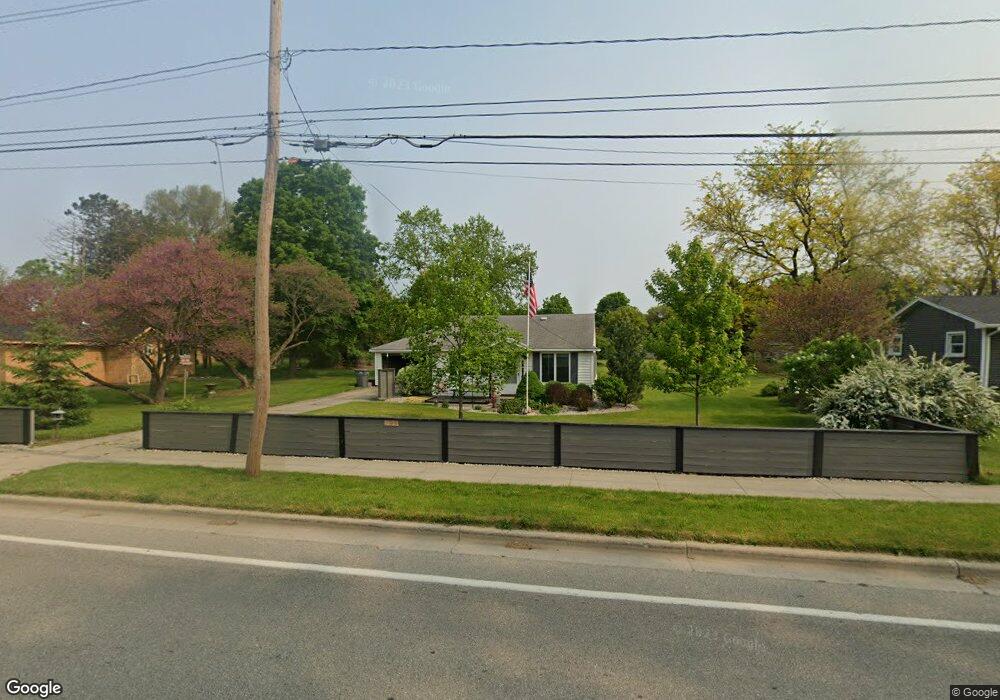
About This Home
This home is located at 795 Foreman St, Lowell, MI 49331 and is currently estimated at $237,306, approximately $228 per square foot. 795 Foreman St is a home located in Kent County with nearby schools including Bushnell Elementary School, Cherry Creek Elementary School, and Lowell Middle School.
Ownership History
We collect this data history from publicly available records. To have your information removed, we recommend requesting removal directly through your county’s website.
Purchase Details
Home Financials for this Owner
Home Financials are based on the most recent Mortgage that was taken out on this home.Home Values in the Area
Average Home Value in this Area
Purchase History
We collect this data history from publicly available records. To have your information removed, we recommend requesting removal directly through your county’s website.
| Date | Buyer | Sale Price | Title Company |
|---|---|---|---|
| $99,000 | -- |
Mortgage History
We collect this data history from publicly available records. To have your information removed, we recommend requesting removal directly through your county’s website.
| Date | Status | Borrower | Loan Amount |
|---|---|---|---|
| Closed | $3,938 | ||
| Closed | $14,000 | ||
| Closed | $107,500 | ||
| Closed | $94,400 | ||
| Closed | $23,600 | ||
| Closed | $94,050 |
Tax History
We collect this data history from publicly available records. To have your information removed, we recommend requesting removal directly through your county’s website.
| Year | Tax Paid | Tax Assessment Tax Assessment Total Assessment is a certain percentage of the fair market value that is determined by local assessors to be the total taxable value of land and additions on the property. | Land | Improvement |
|---|---|---|---|---|
| 2025 | $2,033 | $82,400 | $0 | $0 |
| 2024 | $20 | $82,300 | $0 | $0 |
| 2023 | $2,235 | $74,100 | $0 | $0 |
| 2022 | $2,144 | $64,100 | $0 | $0 |
| 2021 | $2,084 | $57,500 | $0 | $0 |
| 2020 | $1,727 | $54,600 | $0 | $0 |
| 2019 | $2,028 | $52,900 | $0 | $0 |
| 2018 | $1,985 | $51,400 | $0 | $0 |
| 2017 | $1,927 | $47,300 | $0 | $0 |
| 2016 | $1,873 | $45,900 | $0 | $0 |
| 2015 | -- | $45,900 | $0 | $0 |
| 2013 | -- | $41,100 | $0 | $0 |
Map
- 792 Godfrey St SE
- 1197 Godfrey St SE
- 1500 Carol Lynne Dr
- 423 N Hudson St SE
- 523 Elm St
- 1401 Sibley St
- 118 N Hudson St SE
- 419 N Monroe St
- 220 King St Unit 10
- 1800 W Main St Unit 105
- 1800 W Main St Unit 50
- 888 Bowes Rd
- 879 Flat River Ct SE
- 529 Avery St
- 212 N Division St
- 222 S Division St
- 12033 Harvest Acre Dr
- 12068 Harvest Acre Dr SE
- 13086 Grand River Dr SE
- 12917 Oak Highland Dr Unit 3
Ask me questions while you tour the home.