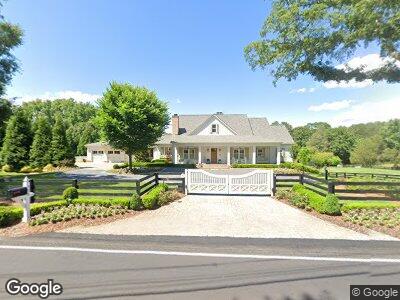
795 Hickory Flat Rd Alpharetta, GA 30004
Estimated Value: $1,570,000 - $2,623,000
4
Beds
6
Baths
5,208
Sq Ft
$380/Sq Ft
Est. Value
About This Home
This home is located at 795 Hickory Flat Rd, Alpharetta, GA 30004 and is currently estimated at $1,978,900, approximately $379 per square foot. 795 Hickory Flat Rd is a home located in Fulton County with nearby schools including Birmingham Falls Elementary School, Northwestern Middle School, and Milton High School.
Ownership History
Date
Name
Owned For
Owner Type
Purchase Details
Closed on
Apr 11, 2018
Sold by
790 Hickory Flat Llc
Bought by
Garrett James M
Current Estimated Value
Purchase Details
Closed on
Jan 19, 2018
Sold by
Smith Robert Hardy
Bought by
790 Hickory Flat Llc
Home Financials for this Owner
Home Financials are based on the most recent Mortgage that was taken out on this home.
Original Mortgage
$875,000
Interest Rate
3.94%
Mortgage Type
New Conventional
Purchase Details
Closed on
Dec 19, 2016
Bought by
780 Hickory Flat Llc
Purchase Details
Closed on
Jul 21, 2015
Sold by
Carter Dianne
Bought by
R Venture Llc
Home Financials for this Owner
Home Financials are based on the most recent Mortgage that was taken out on this home.
Original Mortgage
$144,900
Interest Rate
4.04%
Mortgage Type
New Conventional
Purchase Details
Closed on
Nov 20, 2010
Sold by
Phillips Oscar E
Bought by
Phillips Oscar E and Carter Dianne
Create a Home Valuation Report for This Property
The Home Valuation Report is an in-depth analysis detailing your home's value as well as a comparison with similar homes in the area
Home Values in the Area
Average Home Value in this Area
Purchase History
| Date | Buyer | Sale Price | Title Company |
|---|---|---|---|
| Garrett James M | -- | -- | |
| 790 Hickory Flat Llc | $1,475,000 | -- | |
| 780 Hickory Flat Llc | -- | -- | |
| R Venture Llc | $167,500 | -- | |
| Phillips Oscar E | -- | -- |
Source: Public Records
Mortgage History
| Date | Status | Borrower | Loan Amount |
|---|---|---|---|
| Open | Garrett James M | $484,350 | |
| Open | Garrett James M | $770,000 | |
| Previous Owner | 790 Hickory Flat Llc | $875,000 | |
| Previous Owner | R Venture Llc | $144,900 |
Source: Public Records
Tax History Compared to Growth
Tax History
| Year | Tax Paid | Tax Assessment Tax Assessment Total Assessment is a certain percentage of the fair market value that is determined by local assessors to be the total taxable value of land and additions on the property. | Land | Improvement |
|---|---|---|---|---|
| 2023 | $17,929 | $635,200 | $47,440 | $587,760 |
| 2022 | $4,553 | $436,840 | $31,080 | $405,760 |
| 2021 | $4,605 | $436,840 | $31,080 | $405,760 |
| 2020 | $4,648 | $436,840 | $31,080 | $405,760 |
| 2019 | $483 | $379,560 | $44,680 | $334,880 |
| 2018 | $10,463 | $370,680 | $43,640 | $327,040 |
| 2017 | $582 | $19,960 | $19,960 | $0 |
| 2016 | $1,955 | $67,000 | $30,920 | $36,080 |
| 2015 | $1,883 | $55,320 | $25,560 | $29,760 |
| 2014 | $939 | $30,620 | $860 | $29,760 |
Source: Public Records
Map
Nearby Homes
- 1038 Crossroads Trail
- 2035 Village Walk
- 1013 Crossroads Trail
- 16030 Birmingham Hwy
- 1009 Crossroads Trail
- 118 Slide Ct
- 16036 Birmingham Hwy
- 615 Hickory Flat Rd
- 1001 Crossroads Trail
- 117 Slide Ct
- 4.5 AC Hickory Flat Rd
- 113 Hickory Flat Rd
- 0 New Bull Pen Rd Unit 7529674
- 590 Hickory Mill Ln
- 1094 Bream Dr
- 4060 Orchard Way
- 18390 Birmingham Hwy
- 795 Hickory Flat Rd
- 780 Hickory Flat Rd
- 1004 Madison Hall Ln
- 1007 Madison Hall Ln
- 830 Hickory Flat Rd
- 1008 Madison Hall Ln
- 835 Hickory Flat Rd
- 1011 Madison Hall Ln
- 0 Madison Hall Ln Unit 8875466
- 0 Madison Hall Ln Unit 8474195
- 0 Madison Hall Ln Unit 8850248
- 0 Madison Hall Ln Unit 8872673
- 0 Madison Hall Ln Unit 8872668
- 0 Madison Hall Ln
- 0 Madison Hall Ln
- 15800 Birmingham Hwy
- 15800 Birmingham Hwy Unit 200
- 1015 Madison Hall Ln
- 1016 Madison Hall Ln
- 785 Hickory Flat Rd