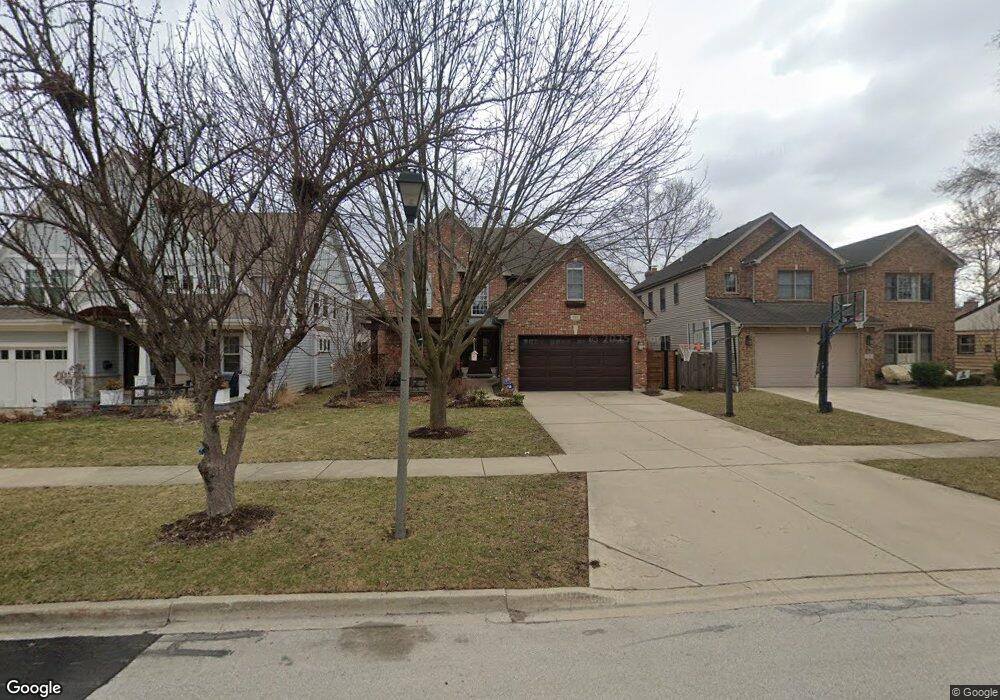
795 S Chatham Ave Elmhurst, IL 60126
Estimated Value: $1,186,000 - $1,402,000
--
Bed
--
Bath
3,575
Sq Ft
$362/Sq Ft
Est. Value
About This Home
This home is located at 795 S Chatham Ave, Elmhurst, IL 60126 and is currently estimated at $1,295,917, approximately $362 per square foot. 795 S Chatham Ave is a home located in DuPage County with nearby schools including Jefferson Elementary School, Bryan Middle School, and York Community High School.
Ownership History
Date
Name
Owned For
Owner Type
Purchase Details
Closed on
May 16, 2002
Sold by
Merkel Henry P and Merkel Cynthia L
Bought by
Glosner Scott E and Glosner Patricia M
Current Estimated Value
Home Financials for this Owner
Home Financials are based on the most recent Mortgage that was taken out on this home.
Original Mortgage
$508,000
Outstanding Balance
$217,976
Interest Rate
7.16%
Estimated Equity
$1,077,941
Purchase Details
Closed on
Nov 12, 2001
Sold by
Sun Construction Building Corp
Bought by
Merkel Henry P and Merkel Cynthia L
Home Financials for this Owner
Home Financials are based on the most recent Mortgage that was taken out on this home.
Original Mortgage
$481,600
Interest Rate
6.69%
Purchase Details
Closed on
Apr 18, 2000
Sold by
Waldschmidt Jon P and Waldschmidt Aileen M
Bought by
Sun Construction Building Corp
Create a Home Valuation Report for This Property
The Home Valuation Report is an in-depth analysis detailing your home's value as well as a comparison with similar homes in the area
Home Values in the Area
Average Home Value in this Area
Purchase History
| Date | Buyer | Sale Price | Title Company |
|---|---|---|---|
| Glosner Scott E | $635,000 | -- | |
| Merkel Henry P | $603,500 | -- | |
| Sun Construction Building Corp | $178,500 | 1St American Title |
Source: Public Records
Mortgage History
| Date | Status | Borrower | Loan Amount |
|---|---|---|---|
| Open | Glosner Scott E | $508,000 | |
| Previous Owner | Merkel Henry P | $481,600 |
Source: Public Records
Tax History Compared to Growth
Tax History
| Year | Tax Paid | Tax Assessment Tax Assessment Total Assessment is a certain percentage of the fair market value that is determined by local assessors to be the total taxable value of land and additions on the property. | Land | Improvement |
|---|---|---|---|---|
| 2024 | $21,157 | $359,058 | $85,258 | $273,800 |
| 2023 | $19,672 | $332,030 | $78,840 | $253,190 |
| 2022 | $18,991 | $319,180 | $75,800 | $243,380 |
| 2021 | $18,528 | $311,240 | $73,910 | $237,330 |
| 2020 | $17,818 | $304,420 | $72,290 | $232,130 |
| 2019 | $17,458 | $289,430 | $68,730 | $220,700 |
| 2018 | $17,823 | $293,700 | $65,050 | $228,650 |
| 2017 | $17,450 | $279,880 | $61,990 | $217,890 |
| 2016 | $17,104 | $263,670 | $58,400 | $205,270 |
| 2015 | $16,961 | $245,640 | $54,410 | $191,230 |
| 2014 | $16,983 | $226,380 | $43,190 | $183,190 |
| 2013 | $16,794 | $229,570 | $43,800 | $185,770 |
Source: Public Records
Map
Nearby Homes
- 827 S Kearsage Ave
- 341 E Madison St
- 900 S Colfax Ave
- 185 E Oneida Ave
- 353 E Butterfield Rd
- 142 E Quincy St
- 427 E Adams St
- 162 E Hale St
- 274 E Crescent Ave
- 441 E Adams St
- 694 S York St
- 613 S Chatham Ave
- 580 S Kearsage Ave
- 705 S Edgewood Ave
- 562 S Poplar Ave
- 494 E Atwood Ct
- 522 E Park Manor Ct
- 426 E Harrison St
- 675 S Edgewood Ave
- 15W320 Concord St
- 799 S Chatham Ave
- 791 S Chatham Ave
- 803 S Chatham Ave
- 787 S Chatham Ave
- 794 S Colfax Ave
- 792 S Colfax Ave
- 800 S Colfax Ave
- 783 S Chatham Ave
- 788 S Colfax Ave
- 804 S Colfax Ave
- 802 S Chatham Ave
- 780 S Colfax Ave
- 808 S Colfax Ave
- 788 S Chatham Ave
- 804 S Chatham Ave
- 815 S Chatham Ave
- 779 S Chatham Ave
- 784 S Chatham Ave
- 808 S Chatham Ave