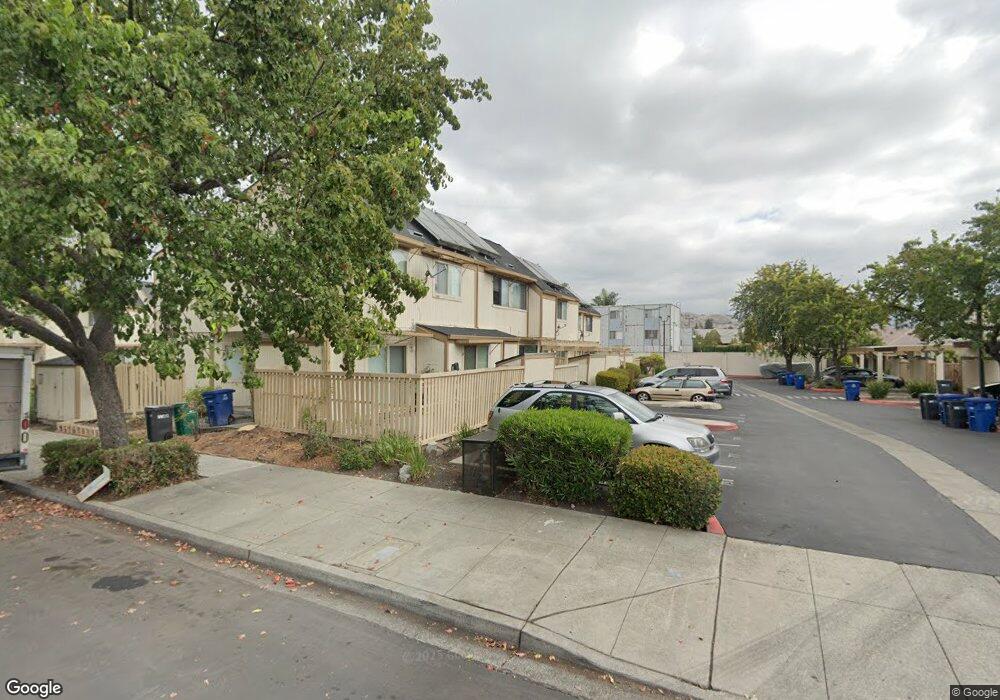
795 Sageleaf Ct Hayward, CA 94544
Tennyson-Alquire NeighborhoodEstimated Value: $542,000 - $673,000
3
Beds
2
Baths
1,246
Sq Ft
$469/Sq Ft
Est. Value
About This Home
This home is located at 795 Sageleaf Ct, Hayward, CA 94544 and is currently estimated at $583,828, approximately $468 per square foot. 795 Sageleaf Ct is a home located in Alameda County with nearby schools including Ruus Elementary School, Cesar Chavez Middle School, and Tennyson High School.
Ownership History
Date
Name
Owned For
Owner Type
Purchase Details
Closed on
Oct 13, 2005
Sold by
Yang Cheuk Wing and Xu Ke Un Winnie
Bought by
Yang Cheuk Wing and Xu Ke Yun Winnie
Current Estimated Value
Home Financials for this Owner
Home Financials are based on the most recent Mortgage that was taken out on this home.
Original Mortgage
$210,000
Interest Rate
5.67%
Mortgage Type
New Conventional
Purchase Details
Closed on
Oct 19, 2004
Sold by
Chen Bao Hai and Le Bich T
Bought by
Xu Ke Yun Winnie and Yang Cheuk Wing
Home Financials for this Owner
Home Financials are based on the most recent Mortgage that was taken out on this home.
Original Mortgage
$280,200
Interest Rate
5.74%
Mortgage Type
Purchase Money Mortgage
Purchase Details
Closed on
Nov 9, 1998
Sold by
Singh Bir and Singh Vimla D
Bought by
Chen Bao Hai and Le Bich T
Home Financials for this Owner
Home Financials are based on the most recent Mortgage that was taken out on this home.
Original Mortgage
$103,950
Interest Rate
6.69%
Create a Home Valuation Report for This Property
The Home Valuation Report is an in-depth analysis detailing your home's value as well as a comparison with similar homes in the area
Home Values in the Area
Average Home Value in this Area
Purchase History
| Date | Buyer | Sale Price | Title Company |
|---|---|---|---|
| Yang Cheuk Wing | -- | Alliance Title Company | |
| Xu Ke Yun Winnie | $350,500 | Chicago Title Co | |
| Chen Bao Hai | $130,000 | North American Title Co |
Source: Public Records
Mortgage History
| Date | Status | Borrower | Loan Amount |
|---|---|---|---|
| Previous Owner | Yang Cheuk Wing | $210,000 | |
| Previous Owner | Xu Ke Yun Winnie | $280,200 | |
| Previous Owner | Chen Bao Hai | $103,950 |
Source: Public Records
Tax History
| Year | Tax Paid | Tax Assessment Tax Assessment Total Assessment is a certain percentage of the fair market value that is determined by local assessors to be the total taxable value of land and additions on the property. | Land | Improvement |
|---|---|---|---|---|
| 2025 | $6,049 | $488,518 | $146,555 | $341,963 |
| 2024 | $6,049 | $478,943 | $143,683 | $335,260 |
| 2023 | $5,960 | $469,554 | $140,866 | $328,688 |
| 2022 | $5,846 | $460,350 | $138,105 | $322,245 |
| 2021 | $5,799 | $451,324 | $135,397 | $315,927 |
| 2020 | $5,736 | $446,697 | $134,009 | $312,688 |
| 2019 | $5,782 | $437,941 | $131,382 | $306,559 |
| 2018 | $5,429 | $429,358 | $128,807 | $300,551 |
| 2017 | $5,305 | $420,943 | $126,283 | $294,660 |
| 2016 | $4,699 | $386,000 | $115,800 | $270,200 |
| 2015 | $3,816 | $310,000 | $93,000 | $217,000 |
| 2014 | $3,369 | $280,000 | $84,000 | $196,000 |
Source: Public Records
Map
Nearby Homes
- 27796 Vasona Ct Unit 2
- 27906 Thackeray Ave
- 27781 Dickens Ave
- 28538 Huntwood Ave
- 27505 Tampa Ave Unit 39
- 27777 Pistachio Ct
- 27773 Pistachio Ct
- 28315 Rochelle Ave
- 139 Mars Ave Unit 139
- 761 Shepherd Ave
- 1177 Thiel Rd
- 27720 Seminole Way
- 29026 Hillview St
- 26937 Huntwood Ave
- 994 Westwood St
- 29131 Delgado Rd
- 29255 Harpoon Way
- 1587 de Lemos Ave
- 29133 De la Cruz Rd
- 250 Schafer Rd
- 793 Sageleaf Ct
- 797 Sageleaf Ct
- 791 Sageleaf Ct
- 789 Sageleaf Ct
- 787 Sageleaf Ct
- 792 Rock Rose Ct
- 790 Rock Rose Ct
- 794 Rock Rose Ct
- 788 Rock Rose Ct
- 796 Rock Rose Ct
- 786 Rock Rose Ct
- 794 Sageleaf Ct
- 803 Climbing Rose Ct
- 792 Sageleaf Ct
- 798 Sageleaf Ct
- 796 Sageleaf Ct
- 790 Sageleaf Ct
- 788 Sageleaf Ct
- 786 Sageleaf Ct
- 805 Climbing Rose Ct
Your Personal Tour Guide
Ask me questions while you tour the home.