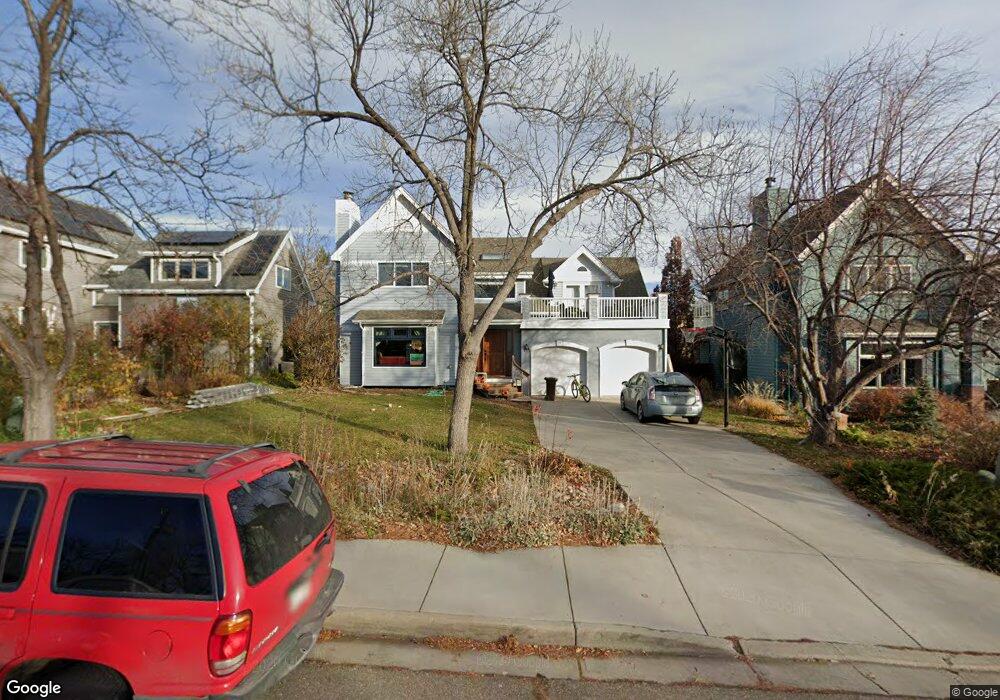
795 Utica Ave Boulder, CO 80304
Wonderland NeighborhoodEstimated Value: $1,534,839 - $1,831,000
4
Beds
4
Baths
2,388
Sq Ft
$713/Sq Ft
Est. Value
About This Home
This home is located at 795 Utica Ave, Boulder, CO 80304 and is currently estimated at $1,703,710, approximately $713 per square foot. 795 Utica Ave is a home located in Boulder County with nearby schools including Foothill Elementary School, Centennial Middle School, and Boulder High School.
Ownership History
Date
Name
Owned For
Owner Type
Purchase Details
Closed on
Jul 6, 2017
Sold by
State Of Colorado
Bought by
Frick Lyman L
Current Estimated Value
Purchase Details
Closed on
May 27, 2011
Sold by
Norton David E and Norton Nancy A
Bought by
Frick Lyman L
Home Financials for this Owner
Home Financials are based on the most recent Mortgage that was taken out on this home.
Original Mortgage
$417,000
Outstanding Balance
$28,980
Interest Rate
4.95%
Mortgage Type
New Conventional
Estimated Equity
$1,674,730
Purchase Details
Closed on
Sep 17, 1984
Bought by
Frick Lyman L and Frick Margaret
Purchase Details
Closed on
Jun 18, 1984
Bought by
Frick Lyman L and Frick Margaret
Purchase Details
Closed on
May 31, 1984
Bought by
Frick Lyman L and Frick Margaret
Purchase Details
Closed on
Jun 24, 1981
Bought by
Frick Lyman L and Frick Margaret
Create a Home Valuation Report for This Property
The Home Valuation Report is an in-depth analysis detailing your home's value as well as a comparison with similar homes in the area
Home Values in the Area
Average Home Value in this Area
Purchase History
| Date | Buyer | Sale Price | Title Company |
|---|---|---|---|
| Frick Lyman L | -- | None Available | |
| Frick Lyman L | $629,900 | Fidelity National Title Insu | |
| Frick Lyman L | $133,200 | -- | |
| Frick Lyman L | $29,000 | -- | |
| Frick Lyman L | $14,500 | -- | |
| Frick Lyman L | $24,000 | -- |
Source: Public Records
Mortgage History
| Date | Status | Borrower | Loan Amount |
|---|---|---|---|
| Open | Frick Lyman L | $417,000 |
Source: Public Records
Tax History Compared to Growth
Tax History
| Year | Tax Paid | Tax Assessment Tax Assessment Total Assessment is a certain percentage of the fair market value that is determined by local assessors to be the total taxable value of land and additions on the property. | Land | Improvement |
|---|---|---|---|---|
| 2025 | $9,772 | $102,819 | $63,706 | $39,113 |
| 2024 | $9,772 | $102,819 | $63,706 | $39,113 |
| 2023 | $9,603 | $111,193 | $69,526 | $45,352 |
| 2022 | $7,921 | $85,297 | $55,704 | $29,593 |
| 2021 | $7,553 | $87,752 | $57,307 | $30,445 |
| 2020 | $6,650 | $76,398 | $41,685 | $34,713 |
| 2019 | $6,548 | $76,398 | $41,685 | $34,713 |
| 2018 | $5,892 | $67,961 | $27,648 | $40,313 |
| 2017 | $5,708 | $75,134 | $30,566 | $44,568 |
| 2016 | $5,257 | $60,727 | $39,561 | $21,166 |
| 2015 | $4,978 | $49,885 | $16,875 | $33,010 |
| 2014 | $4,194 | $49,885 | $16,875 | $33,010 |
Source: Public Records
Map
Nearby Homes
- 700 Utica Ave
- 913 Utica Ave
- 982 Locust Ave
- 1040 Locust Ave
- 1090 Locust Ave
- 1111 Utica Cir
- 1120 Violet Ave
- 1130 Violet Ave
- 1140 Violet Ave
- 4215 Broadway St
- 1150 Violet Ave
- Chautauqua Plan at Violla
- Mesa Plan at Violla
- Eldorado Plan at Violla
- Flatiron Plan at Violla
- Eldorado Plan at Violla
- Betasso Plan at Violla
- Sanitas Plan at Violla
- Bobolink Plan at Violla
- 1160 Violet Ave