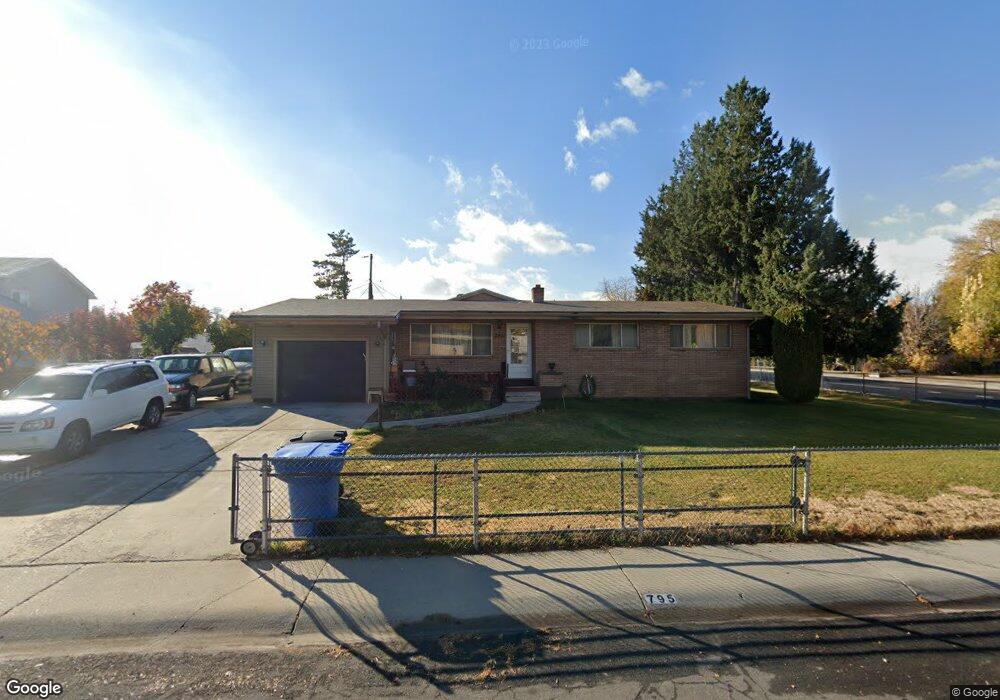
795 W 640 N Orem, UT 84057
Geneva NeighborhoodEstimated Value: $492,000 - $532,000
3
Beds
2
Baths
1,425
Sq Ft
$358/Sq Ft
Est. Value
About This Home
This home is located at 795 W 640 N, Orem, UT 84057 and is currently estimated at $510,377, approximately $358 per square foot. 795 W 640 N is a home located in Utah County with nearby schools including Orem Junior High School, Timpanogos High School, and Karl Maeser Preparatory Academy.
Ownership History
Date
Name
Owned For
Owner Type
Purchase Details
Closed on
Jul 12, 2016
Sold by
Xaochay James Kua
Bought by
Xaochay James Xua and Ly Maiynig
Current Estimated Value
Home Financials for this Owner
Home Financials are based on the most recent Mortgage that was taken out on this home.
Original Mortgage
$104,000
Interest Rate
3.66%
Mortgage Type
New Conventional
Purchase Details
Closed on
Jun 20, 2008
Sold by
Xaochay James Kua
Bought by
Xaochay James Kua
Home Financials for this Owner
Home Financials are based on the most recent Mortgage that was taken out on this home.
Original Mortgage
$137,000
Interest Rate
6%
Mortgage Type
Purchase Money Mortgage
Create a Home Valuation Report for This Property
The Home Valuation Report is an in-depth analysis detailing your home's value as well as a comparison with similar homes in the area
Home Values in the Area
Average Home Value in this Area
Purchase History
| Date | Buyer | Sale Price | Title Company |
|---|---|---|---|
| Xaochay James Xua | -- | First American | |
| Xaochay James Kua | -- | First American Pinehurst | |
| Xaochay James Kua | -- | First American Pinehurst |
Source: Public Records
Mortgage History
| Date | Status | Borrower | Loan Amount |
|---|---|---|---|
| Previous Owner | Xaochay James Xua | $104,000 | |
| Previous Owner | Xaochay James Kua | $137,000 |
Source: Public Records
Tax History
| Year | Tax Paid | Tax Assessment Tax Assessment Total Assessment is a certain percentage of the fair market value that is determined by local assessors to be the total taxable value of land and additions on the property. | Land | Improvement |
|---|---|---|---|---|
| 2025 | $2,027 | $262,515 | -- | -- |
| 2024 | $2,027 | $247,830 | $0 | $0 |
| 2023 | $1,895 | $249,040 | $0 | $0 |
| 2022 | $1,911 | $243,375 | $0 | $0 |
| 2021 | $1,736 | $334,800 | $130,600 | $204,200 |
| 2020 | $1,598 | $302,800 | $104,500 | $198,300 |
| 2019 | $1,405 | $276,900 | $104,500 | $172,400 |
| 2018 | $1,388 | $261,400 | $100,500 | $160,900 |
| 2017 | $1,251 | $126,225 | $0 | $0 |
| 2016 | $1,232 | $114,620 | $0 | $0 |
| 2015 | $1,218 | $107,195 | $0 | $0 |
| 2014 | $1,196 | $104,775 | $0 | $0 |
Source: Public Records
Map
Nearby Homes
- 686 N 835 W
- 557 N Emery Ave
- 954 W 630 N Unit 34,
- 875 W 530 N
- 474 N Emery Ave
- 489 N Beverly Ave
- 1058 W 570 St N
- 1004 W 400 N
- 930 N 980 W
- 1094 W 465 N
- 1086 N 1005 W
- 1123 N 800 W
- 999 W 1100 N
- 1140 W 950 N Unit D302
- 1140 W 950 N Unit E202
- 1140 W 950 N Unit D304
- 1004 N 1090 W Unit 203
- 222 N 1200 W Unit 144
- 222 N 1200 W Unit 84
- 538 W 1120 N
Your Personal Tour Guide
Ask me questions while you tour the home.