7950 4th St Downey, CA 90241
Estimated Value: $898,298 - $1,053,000
About This Home
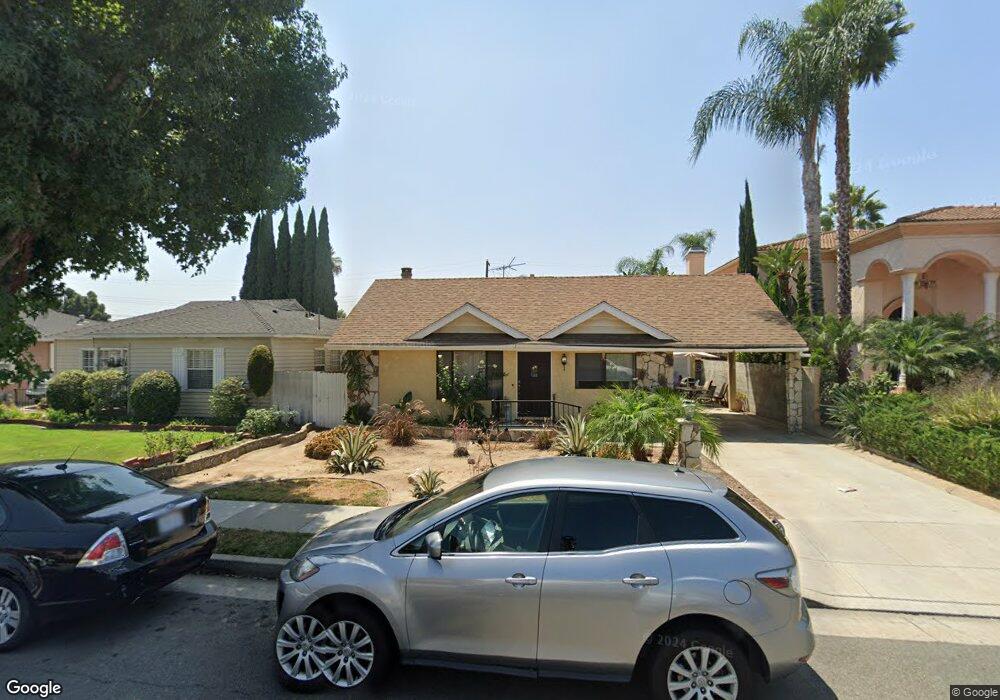
Available now! 3 bedroom, 2 bathroom, charming single-story home featuring 1,000 sq ft of a newly renovated unit in the desirable City of Downey, CA. Newly built home featuring an open-concept kitchen, dining, and living area, tile flooring, quartz countertop. Includes stainless steel gas range stove, recessed lighting, a new HVAC system offering central AC, washer and dryer hookup. The property is a duplex with two detached homes and this home is privately located in the back. Street parking available.
TERMS: Lease: 1-year minimum, Rent: $3,500/month, Total Move-in Cost: $7,000, Utilities: Owner pays water and trash, Tenant pays all other utilities. Renters insurance required. Restrictions: No pets, no smoking.
MINIMUM REQUIREMENT: Income: 3x Rent Amount, Credit: 700+ FICO Score, No evictions, collections or judgments, All adult applicants must complete an individual rental application and authorize a credit and background check.
Property Showing: Saturday, Oct 19th from 11am-1pm or by appointments only.
Ownership History
Purchase Details
Purchase History
| Date | Buyer | Sale Price | Title Company |
|---|---|---|---|
| Sirisut Preecha | -- | -- |
Property History
| Date | Event | Price | List to Sale | Price per Sq Ft |
|---|---|---|---|---|
| 11/16/2024 11/16/24 | Off Market | $3,500 | -- | -- |
| 10/08/2024 10/08/24 | Off Market | $3,500 | -- | -- |
| 10/07/2024 10/07/24 | For Rent | $3,500 | 0.0% | -- |
| 10/06/2024 10/06/24 | For Rent | $3,500 | -- | -- |
Tax History
| Year | Tax Paid | Tax Assessment Tax Assessment Total Assessment is a certain percentage of the fair market value that is determined by local assessors to be the total taxable value of land and additions on the property. | Land | Improvement |
|---|---|---|---|---|
| 2025 | $4,668 | $349,332 | $123,883 | $225,449 |
| 2024 | $4,668 | $342,483 | $121,454 | $221,029 |
| 2023 | $4,479 | $335,769 | $119,073 | $216,696 |
| 2022 | $4,261 | $329,187 | $116,739 | $212,448 |
| 2021 | $4,160 | $322,733 | $114,450 | $208,283 |
| 2019 | $4,056 | $313,162 | $111,056 | $202,106 |
| 2018 | $3,883 | $307,023 | $108,879 | $198,144 |
| 2017 | $3,817 | $301,004 | $106,745 | $194,259 |
| 2016 | $3,759 | $295,102 | $104,652 | $190,450 |
| 2015 | $3,706 | $290,671 | $103,081 | $187,590 |
| 2014 | $3,506 | $284,978 | $101,062 | $183,916 |
Map
- 8110 3rd St
- 10736 La Reina Ave
- 10538 La Reina Ave
- 10520 Wiley Burke Ave
- 10308 Morning Ave
- 8316 Cherokee Dr
- 8354 La Villa St
- 10617 Dolan Ave
- 10531 Dolan Ave
- 11614 Pruess Ave
- 11523 Richeon Ave
- 10253 Hopeland Ave
- 7738 Adwen St
- 7513 Pivot St
- 11410 Dolan Ave
- 11410 Dolan Ave Unit 341
- 11033 Old River School Rd Unit 8
- 11715 Samoline Ave
- 10246 Julius Ave
- 11410 Brookshire Ave Unit 117
Ask me questions while you tour the home.