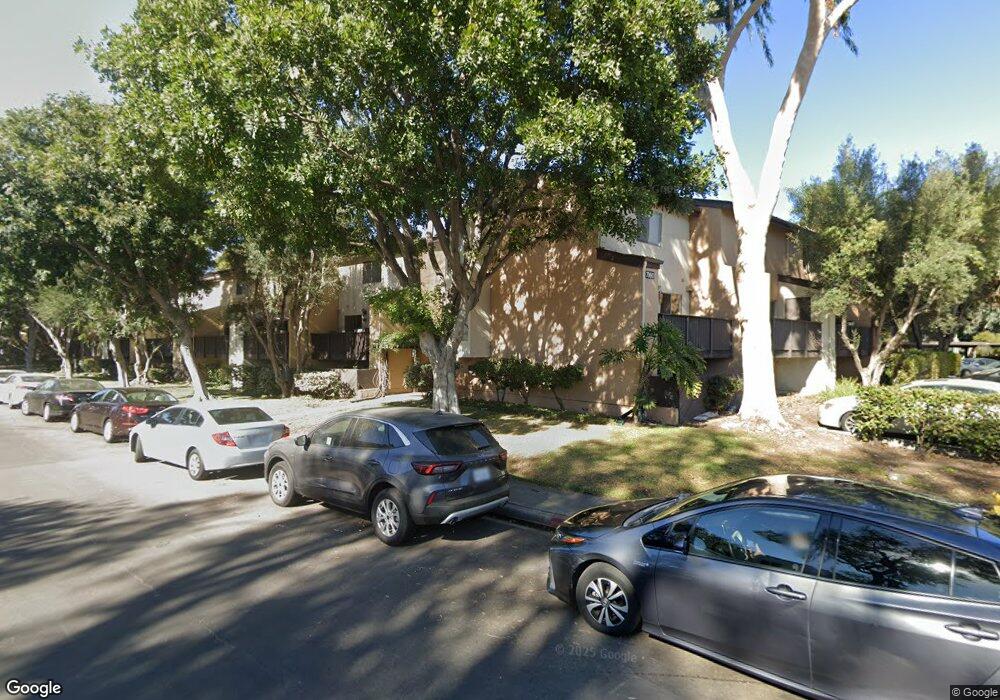
7950 Mission Center Ct Unit A San Diego, CA 92108
Mission Valley NeighborhoodEstimated Value: $416,000 - $444,000
1
Bed
1
Bath
726
Sq Ft
$590/Sq Ft
Est. Value
About This Home
This home is located at 7950 Mission Center Ct Unit A, San Diego, CA 92108 and is currently estimated at $428,241, approximately $589 per square foot. 7950 Mission Center Ct Unit A is a home located in San Diego County with nearby schools including Nipaquay Elementary, Jones Elementary School, and Taft Middle School.
Ownership History
Date
Name
Owned For
Owner Type
Purchase Details
Closed on
Nov 5, 2003
Sold by
Nelson Randall S and Nelson Susan L
Bought by
Nelson Randall S and Nelson Susan L
Current Estimated Value
Purchase Details
Closed on
Mar 15, 2000
Sold by
Garrett Wayne S and Garrett Rebecca A
Bought by
Nelson Randall S and Nelson Susan L
Purchase Details
Closed on
Feb 16, 1999
Sold by
Duke Charles J and Duke Lois L
Bought by
Garrett Wayne S and Garrett Rebecca A
Purchase Details
Closed on
Aug 11, 1993
Sold by
Morgan Scott H
Bought by
Duke Charles J and Duke Lois L
Home Financials for this Owner
Home Financials are based on the most recent Mortgage that was taken out on this home.
Original Mortgage
$74,358
Interest Rate
7.09%
Mortgage Type
VA
Purchase Details
Closed on
Sep 1, 1988
Create a Home Valuation Report for This Property
The Home Valuation Report is an in-depth analysis detailing your home's value as well as a comparison with similar homes in the area
Home Values in the Area
Average Home Value in this Area
Purchase History
| Date | Buyer | Sale Price | Title Company |
|---|---|---|---|
| Nelson Randall S | -- | -- | |
| Nelson Randall S | -- | California Title Company | |
| Garrett Wayne S | -- | California Title Company | |
| Duke Charles J | $73,000 | Fidelity National Title | |
| -- | $58,900 | -- |
Source: Public Records
Mortgage History
| Date | Status | Borrower | Loan Amount |
|---|---|---|---|
| Previous Owner | Duke Charles J | $74,358 |
Source: Public Records
Tax History Compared to Growth
Tax History
| Year | Tax Paid | Tax Assessment Tax Assessment Total Assessment is a certain percentage of the fair market value that is determined by local assessors to be the total taxable value of land and additions on the property. | Land | Improvement |
|---|---|---|---|---|
| 2025 | $1,628 | $132,381 | $50,142 | $82,239 |
| 2024 | $1,628 | $129,786 | $49,159 | $80,627 |
| 2023 | $1,591 | $127,243 | $48,196 | $79,047 |
| 2022 | $1,549 | $124,749 | $47,251 | $77,498 |
| 2021 | $1,539 | $122,304 | $46,325 | $75,979 |
| 2020 | $1,521 | $121,050 | $45,850 | $75,200 |
| 2019 | $1,494 | $118,677 | $44,951 | $73,726 |
| 2018 | $1,398 | $116,351 | $44,070 | $72,281 |
| 2017 | $1,365 | $114,070 | $43,206 | $70,864 |
| 2016 | $1,343 | $111,834 | $42,359 | $69,475 |
| 2015 | $1,324 | $110,155 | $41,723 | $68,432 |
| 2014 | $1,304 | $107,998 | $40,906 | $67,092 |
Source: Public Records
Map
Nearby Homes
- 7952 Mission Center Ct Unit D
- 7954 Mission Center Ct Unit B
- 7948 Mission Center Ct Unit M
- 7974 Mission Center Ct Unit H
- 8069 Caminito de Pizza Unit F
- 8027 Caminito de Pizza Unit B
- 8015 Caminito de Pizza Unit B
- 1361 Caminito Gabaldon Unit F
- 8069 Caminito de Pizza Unit A
- 8023 Caminito de Pizza Unit E
- 8019 Caminito de Pizza Unit B
- 1395 Caminito Gabaldon Unit C
- 1349 Caminito Gabaldon Unit C
- 8075 Caminito de Pizza Unit C
- 1341 Caminito Gabaldon Unit A
- 1317 Caminito Gabaldon Unit B
- 8211 Station Village Ln Unit 1111
- 8211 Station Village Ln Unit 1103
- 7853 Inception Way
- 7839 Inception Way
- 7950 Mission Center Ct Unit G
- 7950 Mission Center Ct Unit D
- 7950 Mission Center Ct Unit H
- 7950 Mission Center Ct Unit C
- 7950 Mission Center Ct Unit E
- 7950 Mission Center Ct Unit B
- 7950 Mission Center Ct Unit F
- 7952 Mission Center Ct Unit C
- 7952 Mission Center Ct Unit G
- 7952 Mission Center Ct Unit D
- 7952 Mission Center Ct
- 7952 Mission Center Ct Unit C
- 7952 Mission Center Ct Unit H
- 7952 Mission Center Ct Unit G
- 7952 Mission Center Ct Unit F
- 7952 Mission Center Ct Unit B
- 7952 Mission Center Ct Unit E
- 7952 Mission Center Ct Unit A
- 7944 Mission Center Ct Unit G
- 7944 Mission Center Ct Unit D