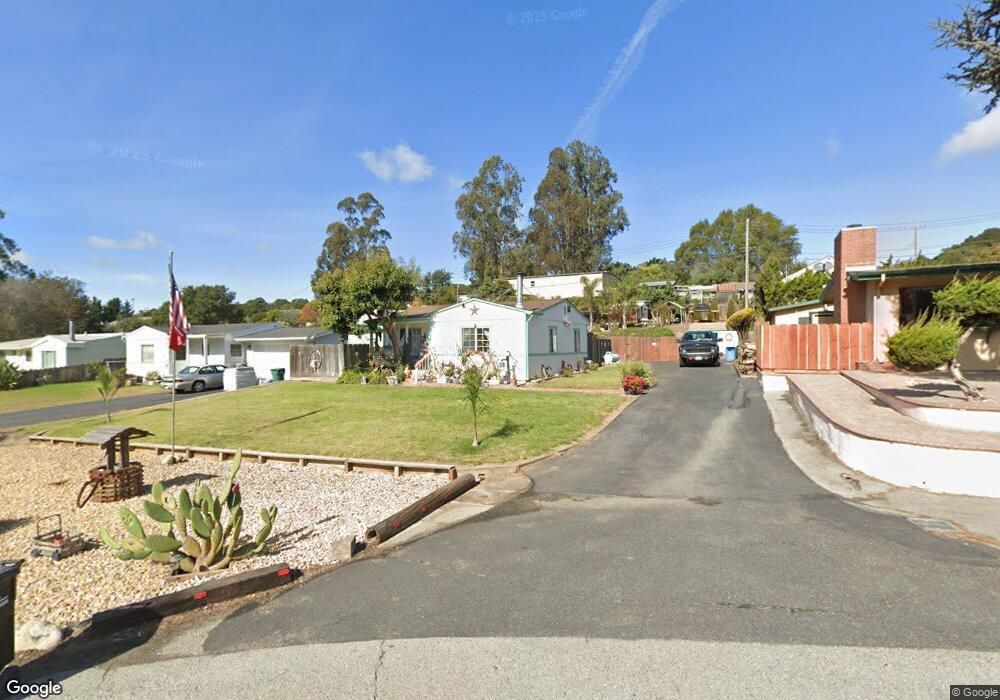
7954 Lavender Ln Salinas, CA 93907
Estimated Value: $481,957 - $798,000
2
Beds
1
Bath
750
Sq Ft
$825/Sq Ft
Est. Value
About This Home
This home is located at 7954 Lavender Ln, Salinas, CA 93907 and is currently estimated at $618,489, approximately $824 per square foot. 7954 Lavender Ln is a home located in Monterey County with nearby schools including North Monterey County Middle School, North Monterey County High School, and Oasis Charter Public.
Ownership History
Date
Name
Owned For
Owner Type
Purchase Details
Closed on
Oct 16, 2025
Sold by
Department Of Transportation
Bought by
Zavala Marcos and Gonzalez Bianca
Current Estimated Value
Purchase Details
Closed on
Aug 28, 2024
Sold by
State Of California
Bought by
Hays Katherine M
Purchase Details
Closed on
Feb 28, 2018
Sold by
Sanchez Jerry Lee and Sanchez Jerry L
Bought by
Revocab Sanchez Jerry Lee and Revocab 2018 Jerry Lee Sanchez
Purchase Details
Closed on
Dec 17, 2009
Sold by
State Of California
Bought by
Sanchez Jerry L
Purchase Details
Closed on
Oct 28, 1996
Sold by
Abid Thamir Kizar
Bought by
Sanchez Jerry L
Home Financials for this Owner
Home Financials are based on the most recent Mortgage that was taken out on this home.
Original Mortgage
$131,580
Interest Rate
8.11%
Mortgage Type
VA
Purchase Details
Closed on
Jul 3, 1995
Sold by
Blaine Eugene E and Blaine Geoffrey Lee
Bought by
Abid Thamir Kizar
Create a Home Valuation Report for This Property
The Home Valuation Report is an in-depth analysis detailing your home's value as well as a comparison with similar homes in the area
Home Values in the Area
Average Home Value in this Area
Purchase History
| Date | Buyer | Sale Price | Title Company |
|---|---|---|---|
| Zavala Marcos | $415,000 | None Listed On Document | |
| Hays Katherine M | $5,500 | None Listed On Document | |
| Revocab Sanchez Jerry Lee | -- | None Available | |
| Sanchez Jerry L | $500 | None Available | |
| Sanchez Jerry L | $129,000 | Old Republic Title Company | |
| Abid Thamir Kizar | $65,000 | Stewart Title |
Source: Public Records
Mortgage History
| Date | Status | Borrower | Loan Amount |
|---|---|---|---|
| Previous Owner | Sanchez Jerry L | $131,580 |
Source: Public Records
Tax History
| Year | Tax Paid | Tax Assessment Tax Assessment Total Assessment is a certain percentage of the fair market value that is determined by local assessors to be the total taxable value of land and additions on the property. | Land | Improvement |
|---|---|---|---|---|
| 2025 | $547 | $210,712 | $114,636 | $96,076 |
| 2024 | $547 | $206,582 | $112,389 | $94,193 |
| 2023 | $594 | $202,533 | $110,186 | $92,347 |
| 2022 | $674 | $198,563 | $108,026 | $90,537 |
| 2021 | $645 | $194,670 | $105,908 | $88,762 |
| 2020 | $578 | $192,675 | $104,823 | $87,852 |
| 2019 | $574 | $188,898 | $102,768 | $86,130 |
| 2018 | $587 | $185,195 | $100,753 | $84,442 |
| 2017 | $569 | $181,565 | $98,778 | $82,787 |
| 2016 | $600 | $178,006 | $96,842 | $81,164 |
| 2015 | $569 | $175,333 | $95,388 | $79,945 |
| 2014 | $549 | $171,899 | $93,520 | $78,379 |
Source: Public Records
Map
Nearby Homes
- 7190 Azzelio Way
- 18221 Berta Canyon Rd
- 6967 Valle Pacifico Rd
- 7013 Valle Pacifico Rd
- 18191 Berta Canyon Rd
- 7183 Tustin Rd
- 19033 Beatrice Dr
- 17780 Berta Canyon Rd
- 6640 Kim Ann Ln
- 17617 Pond Derosa Ln Unit 29
- 17633 Pond Derosa Ln
- 17705 Pond Derosa Ln
- 9194 Coker Rd
- 9340 Pollock Ln
- 6477 Boyer Dr
- 319 Echo Valley Rd
- 17945 Pesante Rd
- 19705 Moonglow Rd
- 0 California 156
- 17918 Pesante Rd
- 7960 Lavender Ln
- 7948 Lavender Ln
- 7966 Lavender Ln
- 7944 Lavender Ln
- 18026 Moro Rd
- 7942 Lavender Ln
- 7938 Lavender Ln
- 18010 Moro Rd
- 17892 Moro Rd Unit A
- 18050 Moro Rd
- 18000 Moro Rd
- 2578 El Camino Real N Unit A
- 2578 El Camino Real N
- 18060 Moro Rd
- 2574 El Camino Real
- 7934 Lavender Ln
- 18080 Moro Rd
- 7725 Fallen Leaf Ln
- 7715 Fallen Leaf Ln
- 2626 El Camino Real N
Your Personal Tour Guide
Ask me questions while you tour the home.