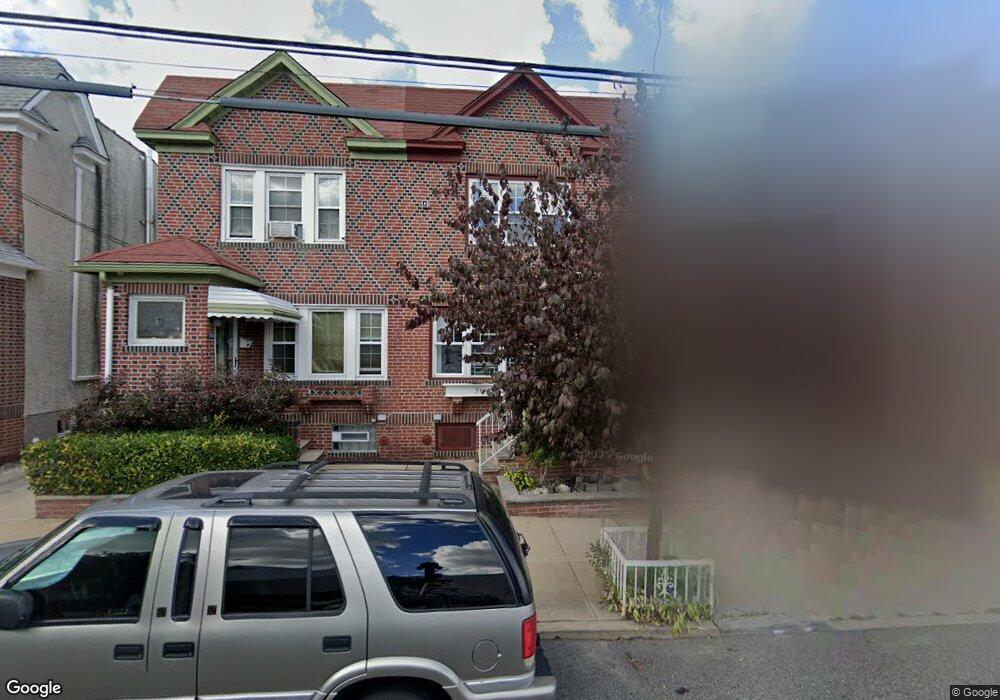
7955 69th Rd Middle Village, NY 11379
Middle Village NeighborhoodEstimated Value: $714,185 - $840,000
--
Bed
--
Bath
1,152
Sq Ft
$688/Sq Ft
Est. Value
About This Home
This home is located at 7955 69th Rd, Middle Village, NY 11379 and is currently estimated at $792,046, approximately $687 per square foot. 7955 69th Rd is a home located in Queens County with nearby schools including P.S. 87 - Middle Village, Queens Metropolitan High School, and Elm Community Charter School.
Ownership History
Date
Name
Owned For
Owner Type
Purchase Details
Closed on
Sep 9, 2003
Sold by
Braccia Jeanette
Bought by
Figueroa Eric and Vega Alice
Current Estimated Value
Home Financials for this Owner
Home Financials are based on the most recent Mortgage that was taken out on this home.
Original Mortgage
$297,600
Interest Rate
6.09%
Mortgage Type
Purchase Money Mortgage
Create a Home Valuation Report for This Property
The Home Valuation Report is an in-depth analysis detailing your home's value as well as a comparison with similar homes in the area
Home Values in the Area
Average Home Value in this Area
Purchase History
| Date | Buyer | Sale Price | Title Company |
|---|---|---|---|
| Figueroa Eric | $372,000 | -- |
Source: Public Records
Mortgage History
| Date | Status | Borrower | Loan Amount |
|---|---|---|---|
| Previous Owner | Figueroa Eric | $297,600 | |
| Closed | Figueroa Eric | $55,800 |
Source: Public Records
Tax History Compared to Growth
Tax History
| Year | Tax Paid | Tax Assessment Tax Assessment Total Assessment is a certain percentage of the fair market value that is determined by local assessors to be the total taxable value of land and additions on the property. | Land | Improvement |
|---|---|---|---|---|
| 2025 | $5,504 | $30,526 | $8,226 | $22,300 |
| 2024 | $5,516 | $28,805 | $7,722 | $21,083 |
| 2023 | $5,245 | $27,515 | $8,019 | $19,496 |
| 2022 | $4,948 | $44,100 | $12,240 | $31,860 |
| 2021 | $5,223 | $43,920 | $12,240 | $31,680 |
| 2020 | $5,088 | $41,700 | $12,240 | $29,460 |
| 2019 | $4,729 | $39,360 | $12,240 | $27,120 |
| 2018 | $4,376 | $22,929 | $10,124 | $12,805 |
| 2017 | $4,155 | $21,854 | $8,524 | $13,330 |
| 2016 | $4,059 | $21,854 | $8,524 | $13,330 |
| 2015 | $2,267 | $21,198 | $9,983 | $11,215 |
| 2014 | $2,267 | $20,004 | $11,102 | $8,902 |
Source: Public Records
Map
Nearby Homes