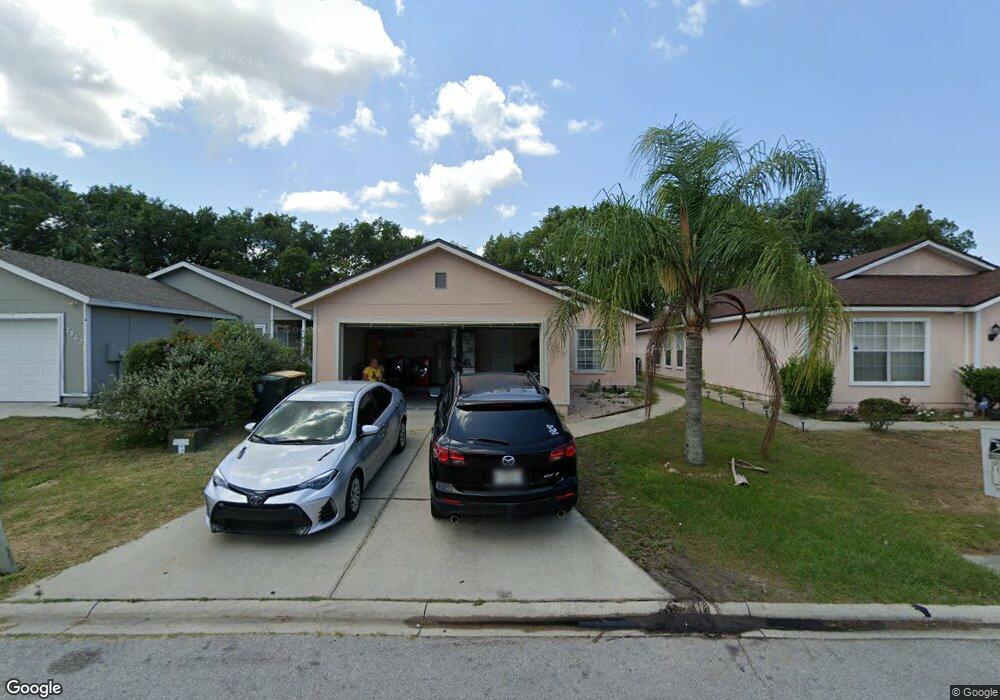
7956 Cherry Blossom Dr S Jacksonville, FL 32216
Holiday Hill NeighborhoodEstimated Value: $238,822 - $273,000
4
Beds
2
Baths
1,468
Sq Ft
$172/Sq Ft
Est. Value
About This Home
This home is located at 7956 Cherry Blossom Dr S, Jacksonville, FL 32216 and is currently estimated at $252,206, approximately $171 per square foot. 7956 Cherry Blossom Dr S is a home located in Duval County with nearby schools including Woodland Acres Elementary School, Southside Middle School, and Englewood High School.
Ownership History
Date
Name
Owned For
Owner Type
Purchase Details
Closed on
Feb 25, 2022
Sold by
Charles and Carline
Bought by
Fontela Martin and Fontela Sandra
Current Estimated Value
Home Financials for this Owner
Home Financials are based on the most recent Mortgage that was taken out on this home.
Original Mortgage
$164,184
Outstanding Balance
$153,401
Interest Rate
3.92%
Mortgage Type
New Conventional
Estimated Equity
$98,805
Purchase Details
Closed on
Jun 28, 2002
Sold by
Irvin Markeita and Irvin Benny
Bought by
Charles Jhon and Charles Carline
Home Financials for this Owner
Home Financials are based on the most recent Mortgage that was taken out on this home.
Original Mortgage
$100,109
Interest Rate
6.79%
Mortgage Type
FHA
Purchase Details
Closed on
Jan 14, 2000
Sold by
Centex Homes
Bought by
Spaulding Markeita
Home Financials for this Owner
Home Financials are based on the most recent Mortgage that was taken out on this home.
Original Mortgage
$83,783
Interest Rate
7.87%
Create a Home Valuation Report for This Property
The Home Valuation Report is an in-depth analysis detailing your home's value as well as a comparison with similar homes in the area
Home Values in the Area
Average Home Value in this Area
Purchase History
| Date | Buyer | Sale Price | Title Company |
|---|---|---|---|
| Fontela Martin | $205,230 | Mti Title | |
| Charles Jhon | $100,900 | -- | |
| Spaulding Markeita | $83,800 | -- |
Source: Public Records
Mortgage History
| Date | Status | Borrower | Loan Amount |
|---|---|---|---|
| Open | Fontela Martin | $164,184 | |
| Previous Owner | Charles Jhon | $100,109 | |
| Previous Owner | Spaulding Markeita | $83,783 |
Source: Public Records
Tax History Compared to Growth
Tax History
| Year | Tax Paid | Tax Assessment Tax Assessment Total Assessment is a certain percentage of the fair market value that is determined by local assessors to be the total taxable value of land and additions on the property. | Land | Improvement |
|---|---|---|---|---|
| 2025 | $3,904 | $207,184 | $50,000 | $157,184 |
| 2024 | $3,853 | $207,835 | $50,000 | $157,835 |
| 2023 | $3,853 | $203,924 | $45,000 | $158,924 |
| 2022 | $1,350 | $109,973 | $0 | $0 |
| 2021 | $1,330 | $106,770 | $0 | $0 |
| 2020 | $1,313 | $105,296 | $0 | $0 |
| 2019 | $1,291 | $102,929 | $0 | $0 |
| 2018 | $1,268 | $101,010 | $0 | $0 |
| 2017 | $1,246 | $98,933 | $0 | $0 |
| 2016 | $1,232 | $96,899 | $0 | $0 |
| 2015 | $1,243 | $96,226 | $0 | $0 |
| 2014 | $1,242 | $95,463 | $0 | $0 |
Source: Public Records
Map
Nearby Homes
- 0 Pecan St Unit A4529208
- 245 Aralia Ln
- 288 Aralia Ln
- 8725 Alton Ave
- 232 Aralia Ln
- 8339 Woods Ave
- 8401 Highfield Ave
- 7866 Aquarius Cir S
- 8300 Berry Ave
- 7817 Aquarius Cir S
- 8331 Berry Ave
- 7709 Eaton Ave
- 8331 Cocoa Ave
- 691 Grove Park Blvd
- 745 Century 21 Dr
- 443 Holiday Hill Cir W
- 7716 Galveston Ave
- 8442 Dandy Ave
- 8454 Dandy Ave
- 8015 Galveston Ave
- 7955 Cherry Blossom Dr S
- 7947 Cherry Blossom Dr S
- 7963 Cherry Blossom Dr S
- 7939 Cherry Blossom Dr S
- 7956 Cherry Blossom Dr N
- 7964 Cherry Blossom Dr N
- 7948 Cherry Blossom Dr N
- 7933 Cherry Blossom Dr S
- 7940 Cherry Blossom Dr N
- 7950 Cherry Blossom Dr S
- 7932 Cherry Blossom Dr N
- 7962 Cherry Blossom Dr S
- 7925 Cherry Blossom Dr S
- 7986 Cherry Blossom Dr S
- 7994 Cherry Blossom Dr S
- 7944 Cherry Blossom Dr S
- 7980 Cherry Blossom Dr S
- 7995 Cherry Blossom Dr N
- 7938 Cherry Blossom Dr S
- 7924 Cherry Blossom Dr N