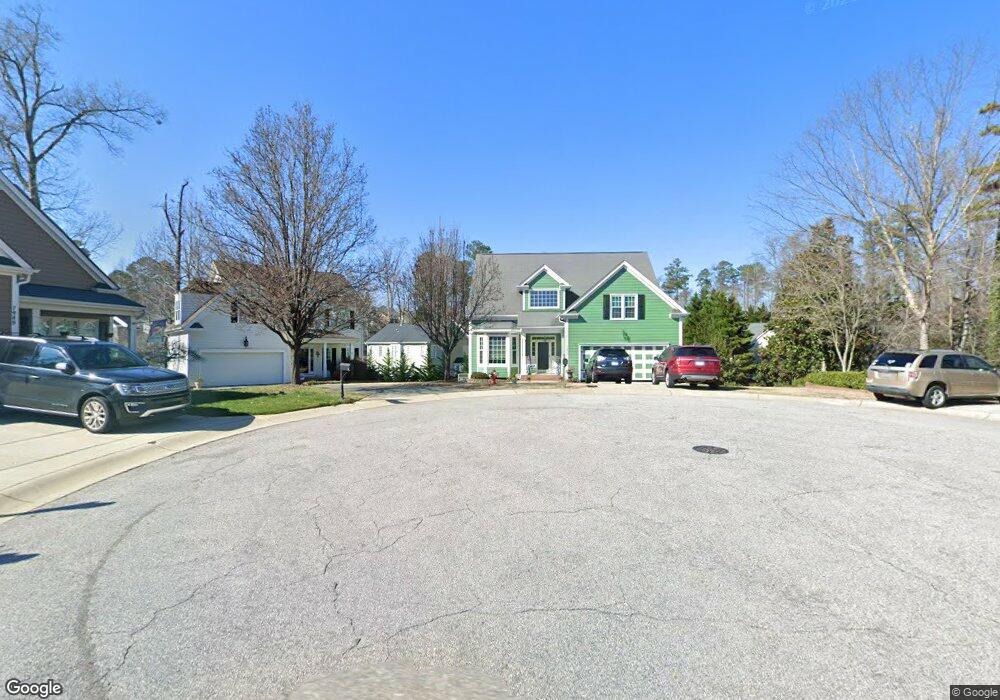
7956 Mill Trace Run Raleigh, NC 27615
Estimated Value: $455,000 - $557,000
--
Bed
3
Baths
2,376
Sq Ft
$214/Sq Ft
Est. Value
About This Home
This home is located at 7956 Mill Trace Run, Raleigh, NC 27615 and is currently estimated at $508,931, approximately $214 per square foot. 7956 Mill Trace Run is a home located in Wake County with nearby schools including North Ridge Elementary School, West Millbrook Middle School, and Millbrook High School.
Ownership History
Date
Name
Owned For
Owner Type
Purchase Details
Closed on
Jul 31, 2001
Sold by
John Robertson Building Company
Bought by
Jones Mark W and Jones Kristine A
Current Estimated Value
Home Financials for this Owner
Home Financials are based on the most recent Mortgage that was taken out on this home.
Original Mortgage
$225,000
Outstanding Balance
$87,388
Interest Rate
7.09%
Estimated Equity
$421,543
Purchase Details
Closed on
Aug 8, 2000
Sold by
Harps Mill Development Llc
Bought by
John Robertson Building Company
Home Financials for this Owner
Home Financials are based on the most recent Mortgage that was taken out on this home.
Original Mortgage
$165,000
Interest Rate
8.17%
Create a Home Valuation Report for This Property
The Home Valuation Report is an in-depth analysis detailing your home's value as well as a comparison with similar homes in the area
Home Values in the Area
Average Home Value in this Area
Purchase History
| Date | Buyer | Sale Price | Title Company |
|---|---|---|---|
| Jones Mark W | $225,000 | -- | |
| John Robertson Building Company | $32,000 | -- |
Source: Public Records
Mortgage History
| Date | Status | Borrower | Loan Amount |
|---|---|---|---|
| Open | Jones Mark W | $225,000 | |
| Previous Owner | John Robertson Building Company | $165,000 | |
| Closed | John Robertson Building Company | $15,000 |
Source: Public Records
Tax History Compared to Growth
Tax History
| Year | Tax Paid | Tax Assessment Tax Assessment Total Assessment is a certain percentage of the fair market value that is determined by local assessors to be the total taxable value of land and additions on the property. | Land | Improvement |
|---|---|---|---|---|
| 2025 | $4,325 | $493,628 | $145,000 | $348,628 |
| 2024 | $4,307 | $493,628 | $145,000 | $348,628 |
| 2023 | $3,738 | $341,133 | $70,000 | $271,133 |
| 2022 | $3,474 | $341,133 | $70,000 | $271,133 |
| 2021 | $3,339 | $341,133 | $70,000 | $271,133 |
| 2020 | $3,279 | $341,133 | $70,000 | $271,133 |
| 2019 | $3,133 | $268,609 | $63,000 | $205,609 |
| 2018 | $2,955 | $268,609 | $63,000 | $205,609 |
| 2017 | $2,814 | $268,609 | $63,000 | $205,609 |
| 2016 | $2,757 | $268,609 | $63,000 | $205,609 |
| 2015 | $2,659 | $254,857 | $56,000 | $198,857 |
| 2014 | $2,522 | $254,857 | $56,000 | $198,857 |
Source: Public Records
Map
Nearby Homes
- 8621 Swarthmore Dr
- 2509 Goudy Dr
- 8800 Harps Mill Rd
- 2709 Iman Dr
- 2216 Gresham Lake Rd
- 8516 Wheeling Dr
- 2505 Coxindale Dr
- 8324 Bellingham Cir
- 7620 Rainwater Rd
- 2516 Constitution Dr
- 8700 Den Ct
- 2301 Declaration Dr
- 2105 Prescott Place
- 2353 Florida Ct
- 2328 Florida Ct
- 7316 Massachusetts Ct
- 2317 Declaration Dr
- 8804 Colesbury Dr
- 7516 Wingfoot Dr
- 7404 Rainwater Rd
- 7953 Mill Trace Run
- 7848 Harps Mill Woods Run
- 7948 Mill Trace Run
- 7949 Mill Trace Run
- 7844 Harps Mill Woods Run
- 7944 Mill Trace Run
- 7945 Mill Trace Run
- 8645 Paddle Wheel Dr
- 7840 Harps Mill Woods Run
- 8701 Paddle Wheel Dr
- 8705 Paddle Wheel Dr
- 7941 Mill Trace Run
- 7940 Mill Trace Run
- 8641 Paddle Wheel Dr
- 8709 Paddle Wheel Dr
- 8637 Paddle Wheel Dr
- 7841 Harps Mill Woods Run
- 7937 Milltrace Run
- 7836 Harps Mill Woods Run
- 7937 Mill Trace Run