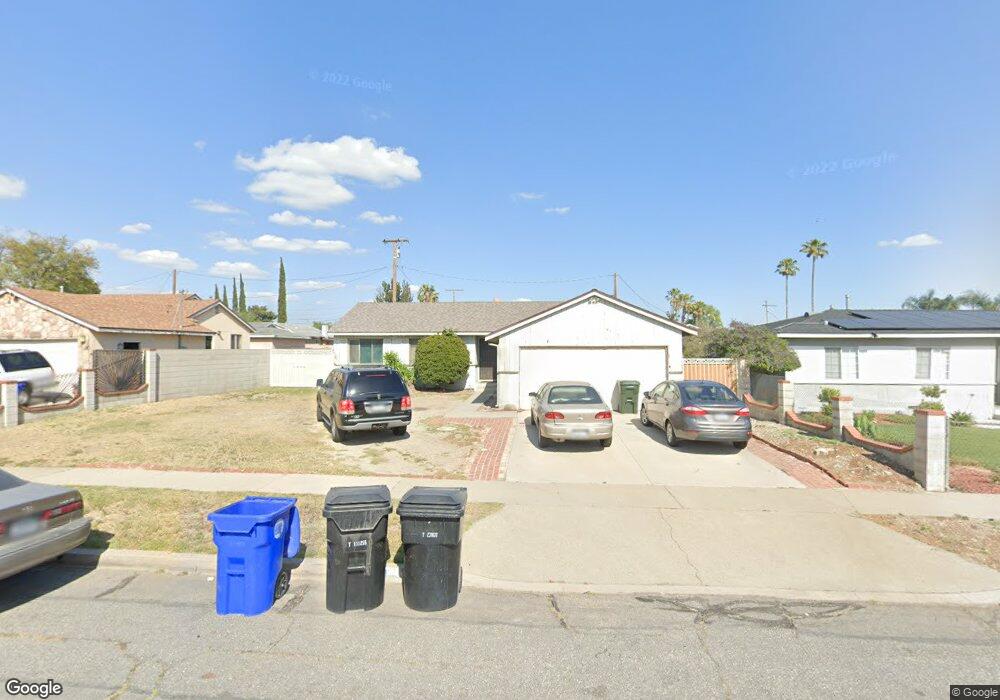
7957 Chantry Ave Fontana, CA 92336
Estimated Value: $534,247 - $621,000
4
Beds
2
Baths
1,337
Sq Ft
$427/Sq Ft
Est. Value
About This Home
This home is located at 7957 Chantry Ave, Fontana, CA 92336 and is currently estimated at $570,562, approximately $426 per square foot. 7957 Chantry Ave is a home located in San Bernardino County with nearby schools including Juniper Elementary School, Almeria Middle School, and Fontana A. B. Miller High School.
Ownership History
Date
Name
Owned For
Owner Type
Purchase Details
Closed on
Jun 7, 2000
Sold by
Kang Tae
Bought by
Gray Angela Denise
Current Estimated Value
Home Financials for this Owner
Home Financials are based on the most recent Mortgage that was taken out on this home.
Original Mortgage
$99,182
Outstanding Balance
$35,090
Interest Rate
8.27%
Mortgage Type
FHA
Estimated Equity
$535,472
Purchase Details
Closed on
Mar 8, 1999
Sold by
Southland Capital Mtg Corp
Bought by
Kang Tae
Home Financials for this Owner
Home Financials are based on the most recent Mortgage that was taken out on this home.
Original Mortgage
$99,847
Interest Rate
6.73%
Mortgage Type
FHA
Purchase Details
Closed on
Jun 19, 1997
Sold by
Lopez Humberto
Bought by
Southland Capital Mtg Corp
Purchase Details
Closed on
Jan 22, 1997
Sold by
Lopez Humberto
Bought by
Lopez Humberto and Lopez Maria Luisa
Purchase Details
Closed on
Oct 31, 1995
Sold by
Pierzina Kenneth M and Pierzina Patricia C
Bought by
Lopez Humberto
Home Financials for this Owner
Home Financials are based on the most recent Mortgage that was taken out on this home.
Original Mortgage
$103,750
Interest Rate
7.38%
Create a Home Valuation Report for This Property
The Home Valuation Report is an in-depth analysis detailing your home's value as well as a comparison with similar homes in the area
Home Values in the Area
Average Home Value in this Area
Purchase History
| Date | Buyer | Sale Price | Title Company |
|---|---|---|---|
| Gray Angela Denise | $100,000 | Fidelity National Title Co | |
| Kang Tae | $100,000 | Northern Counties Title | |
| Kang Tae | -- | Northern Counties Title | |
| Southland Capital Mtg Corp | $118,641 | Fidelity National Title Ins | |
| Lopez Humberto | -- | -- | |
| Lopez Humberto | $107,000 | First American Title Ins Co |
Source: Public Records
Mortgage History
| Date | Status | Borrower | Loan Amount |
|---|---|---|---|
| Open | Gray Angela Denise | $99,182 | |
| Previous Owner | Kang Tae | $99,847 | |
| Previous Owner | Lopez Humberto | $103,750 |
Source: Public Records
Tax History Compared to Growth
Tax History
| Year | Tax Paid | Tax Assessment Tax Assessment Total Assessment is a certain percentage of the fair market value that is determined by local assessors to be the total taxable value of land and additions on the property. | Land | Improvement |
|---|---|---|---|---|
| 2025 | $2,502 | $153,702 | $38,424 | $115,278 |
| 2024 | $2,502 | $150,689 | $37,671 | $113,018 |
| 2023 | $2,560 | $147,734 | $36,932 | $110,802 |
| 2022 | $1,869 | $144,837 | $36,208 | $108,629 |
| 2021 | $1,841 | $141,997 | $35,498 | $106,499 |
| 2020 | $1,822 | $140,541 | $35,134 | $105,407 |
| 2019 | $1,777 | $137,785 | $34,445 | $103,340 |
| 2018 | $1,778 | $135,084 | $33,770 | $101,314 |
| 2017 | $1,743 | $132,435 | $33,108 | $99,327 |
| 2016 | $1,692 | $129,838 | $32,459 | $97,379 |
| 2015 | $1,732 | $127,887 | $31,971 | $95,916 |
| 2014 | $1,720 | $125,382 | $31,345 | $94,037 |
Source: Public Records
Map
Nearby Homes
- 7938 Chantry Ave
- 16554 Reed St
- 16436 Foothill Blvd
- 8147 Cypress Ave
- 8164 Cypress Ave
- 16304 Foothill Blvd
- 8238 Pepper Ave
- 16733 Miller Ave
- 7801 Pinyon Ave
- 7625 Cypress Ave
- 0 Sierra Ave Unit EV22072866
- 16843 Miller Ave
- 16590 Terrace Ln Unit G
- 16203 Foothill Blvd
- 16250 Upland Ave
- 7702 Newport Ct
- 8566 Cypress Ave
- 7908 Tokay Ave Unit 108
- 17196 Barbee St
- 7372 Oleander Ave
- 7947 Chantry Ave
- 7967 Chantry Ave
- 16572 Barbee St
- 16573 Reed St
- 7937 Chantry Ave
- 16582 Barbee St
- 7956 Chantry Ave
- 7946 Chantry Ave
- 7966 Chantry Ave
- 16590 Barbee St
- 16563 Barbee St
- 16555 Barbee St
- 16591 Reed St
- 16573 Barbee St
- 16545 Barbee St
- 7928 Chantry Ave
- 16596 Barbee St
- 16583 Barbee St
- 16537 Barbee St
- 16597 Reed St