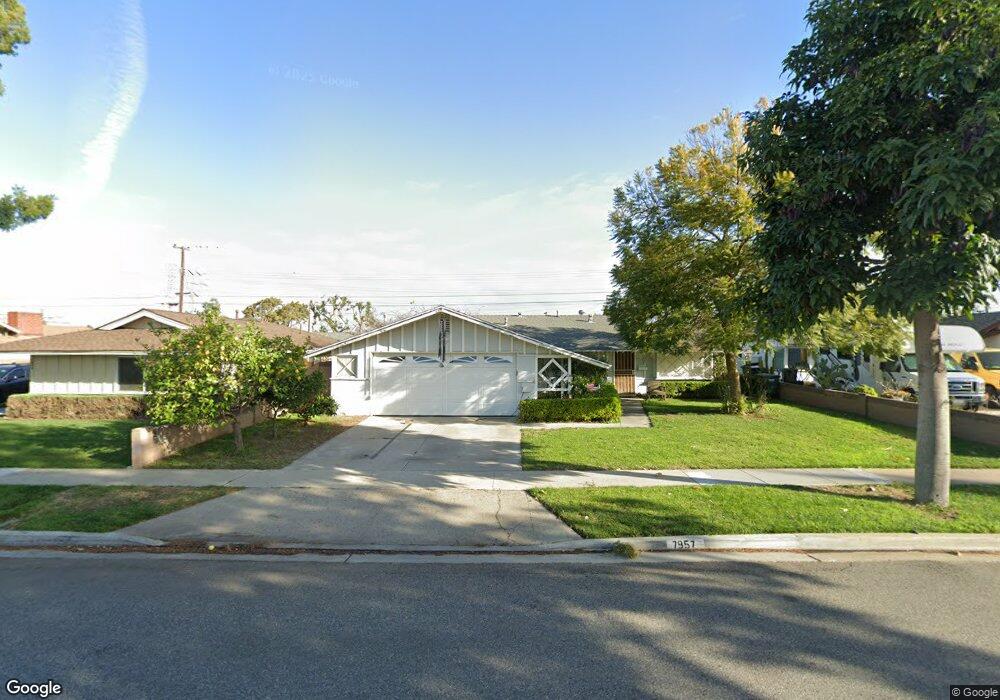
7957 Goldenrod Cir Buena Park, CA 90620
Estimated Value: $803,000 - $847,000
3
Beds
2
Baths
1,067
Sq Ft
$771/Sq Ft
Est. Value
About This Home
This home is located at 7957 Goldenrod Cir, Buena Park, CA 90620 and is currently estimated at $823,102, approximately $771 per square foot. 7957 Goldenrod Cir is a home located in Orange County with nearby schools including Glen H. Dysinger Sr. Elementary School, Brookhurst Junior High School, and Savanna High School.
Ownership History
Date
Name
Owned For
Owner Type
Purchase Details
Closed on
Jan 27, 2010
Sold by
Hyun Theresa K
Bought by
Kaya Chris Y
Current Estimated Value
Purchase Details
Closed on
Nov 29, 2001
Sold by
Hyun Theresa K
Bought by
Kaya Chris Y
Home Financials for this Owner
Home Financials are based on the most recent Mortgage that was taken out on this home.
Original Mortgage
$175,000
Outstanding Balance
$68,382
Interest Rate
6.57%
Estimated Equity
$754,720
Purchase Details
Closed on
Jul 21, 1999
Sold by
Viorel Taut and Viorel Anica
Bought by
Kaya Chris Y
Home Financials for this Owner
Home Financials are based on the most recent Mortgage that was taken out on this home.
Original Mortgage
$153,900
Interest Rate
7.64%
Purchase Details
Closed on
Oct 22, 1997
Sold by
Sergiu Taut
Bought by
Taut Viorel and Taut Anica
Purchase Details
Closed on
Mar 17, 1994
Sold by
Taut Viorel and Taut Anica
Bought by
Taut Sergiu
Create a Home Valuation Report for This Property
The Home Valuation Report is an in-depth analysis detailing your home's value as well as a comparison with similar homes in the area
Home Values in the Area
Average Home Value in this Area
Purchase History
| Date | Buyer | Sale Price | Title Company |
|---|---|---|---|
| Kaya Chris Y | -- | Accommodation | |
| Kaya Chris Y | -- | First American Title Co | |
| Kaya Chris Y | $162,000 | American Title Co | |
| Taut Viorel | -- | -- | |
| Taut Sergiu | -- | Gateway Title Company |
Source: Public Records
Mortgage History
| Date | Status | Borrower | Loan Amount |
|---|---|---|---|
| Open | Kaya Chris Y | $175,000 | |
| Closed | Kaya Chris Y | $153,900 |
Source: Public Records
Tax History Compared to Growth
Tax History
| Year | Tax Paid | Tax Assessment Tax Assessment Total Assessment is a certain percentage of the fair market value that is determined by local assessors to be the total taxable value of land and additions on the property. | Land | Improvement |
|---|---|---|---|---|
| 2025 | $3,016 | $248,976 | $181,413 | $67,563 |
| 2024 | $3,016 | $244,095 | $177,856 | $66,239 |
| 2023 | $2,939 | $239,309 | $174,368 | $64,941 |
| 2022 | $2,897 | $234,617 | $170,949 | $63,668 |
| 2021 | $2,855 | $230,017 | $167,597 | $62,420 |
| 2020 | $2,837 | $227,659 | $165,879 | $61,780 |
| 2019 | $2,769 | $223,196 | $162,627 | $60,569 |
| 2018 | $2,719 | $218,820 | $159,438 | $59,382 |
| 2017 | $2,635 | $214,530 | $156,312 | $58,218 |
| 2016 | $2,586 | $210,324 | $153,247 | $57,077 |
| 2015 | $2,555 | $207,165 | $150,945 | $56,220 |
| 2014 | $2,430 | $203,107 | $147,988 | $55,119 |
Source: Public Records
Map
Nearby Homes
- 8026 Carnation Dr
- 7575 El Escorial Way
- 21 Centerstone Cir
- 8194 Calendula Dr
- 7570 El Chaco Dr
- 7600 Western Ave
- 8434 Periwinkle Dr
- 7430 El Rosal Cir
- 7085 Oregon St
- 7122 Stanton Ave
- 7451 Western Ave
- 8452 Stanton Ave
- 7911 Orangethorpe Ave
- 8054 Teakwood Cir
- 8178 Santa Inez Dr
- 8319 Hickory Dr
- 2697 W Parkside Ln
- 8214 Santa Inez Way
- 7791 Melrose St
- 7561 El Campo Cir
- 7945 Goldenrod Cir
- 7969 Goldenrod Cir
- 7950 Delphinium Cir
- 7940 Delphinium Cir
- 7960 Delphinium Cir
- 7981 Goldenrod Cir
- 7923 Goldenrod Cir
- 7930 Delphinium Cir
- 7970 Delphinium Cir
- 7950 Goldenrod Cir
- 7940 Goldenrod Cir
- 7960 Goldenrod Cir
- 7921 Goldenrod Cir
- 7993 Goldenrod Cir
- 7930 Goldenrod Cir
- 7920 Delphinium Cir
- 7980 Delphinium Cir
- 7861 Stanton Ave
- 7920 Goldenrod Cir
- 7957 Delphinium Cir