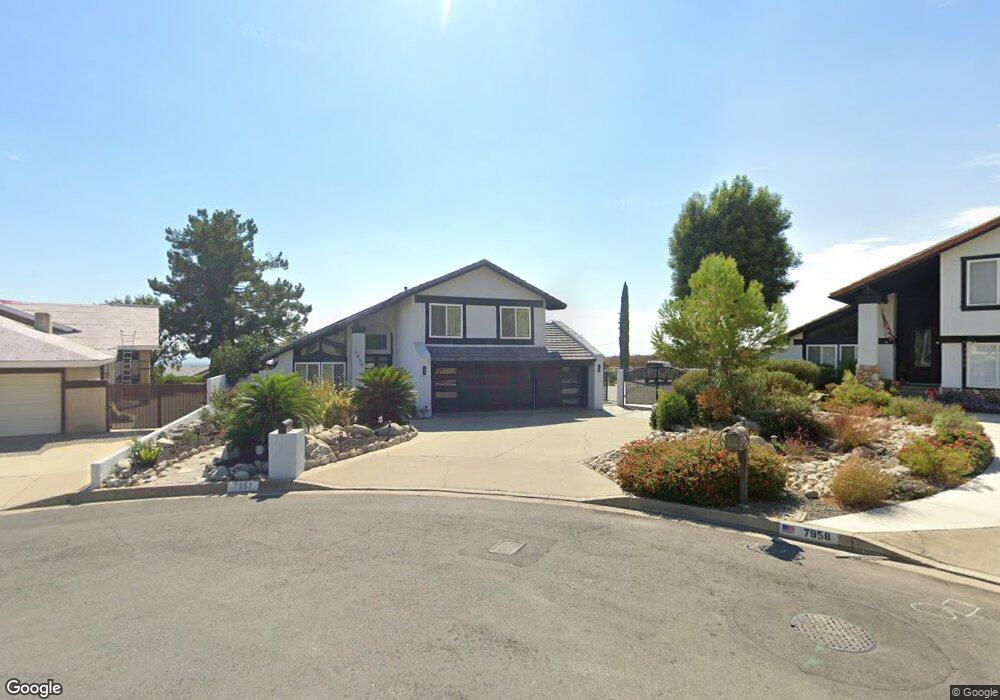
7957 Rosebud St Rancho Cucamonga, CA 91701
Estimated Value: $865,719 - $1,151,000
3
Beds
3
Baths
1,993
Sq Ft
$528/Sq Ft
Est. Value
About This Home
This home is located at 7957 Rosebud St, Rancho Cucamonga, CA 91701 and is currently estimated at $1,052,680, approximately $528 per square foot. 7957 Rosebud St is a home located in San Bernardino County with nearby schools including Floyd M. Stork Elementary, Alta Loma Junior High, and Alta Loma High.
Ownership History
Date
Name
Owned For
Owner Type
Purchase Details
Closed on
Jul 22, 2021
Sold by
Lee Yewmeng and Lee Sandra T
Bought by
Lee Yewmeng and Lee Sandra T
Current Estimated Value
Purchase Details
Closed on
Dec 28, 2020
Sold by
Lee Yewmeng and Lee Sandra T
Bought by
Lee Yewmeng and Lee Sandra T
Home Financials for this Owner
Home Financials are based on the most recent Mortgage that was taken out on this home.
Original Mortgage
$409,000
Outstanding Balance
$364,324
Interest Rate
2.6%
Mortgage Type
New Conventional
Estimated Equity
$688,356
Purchase Details
Closed on
Jul 26, 2003
Sold by
Lee Yewmeng
Bought by
Lee Yewmeng and Pyu Sandra T
Home Financials for this Owner
Home Financials are based on the most recent Mortgage that was taken out on this home.
Original Mortgage
$320,000
Interest Rate
7.95%
Mortgage Type
Purchase Money Mortgage
Purchase Details
Closed on
Jul 20, 2000
Sold by
Asgeirsson Jon M
Bought by
Lee Yewmeng
Home Financials for this Owner
Home Financials are based on the most recent Mortgage that was taken out on this home.
Original Mortgage
$178,100
Interest Rate
9.99%
Create a Home Valuation Report for This Property
The Home Valuation Report is an in-depth analysis detailing your home's value as well as a comparison with similar homes in the area
Home Values in the Area
Average Home Value in this Area
Purchase History
| Date | Buyer | Sale Price | Title Company |
|---|---|---|---|
| Lee Yewmeng | -- | None Available | |
| Lee Yewmeng | -- | Placer Title Company | |
| Lee Yewmeng | -- | Fidelity | |
| Lee Yewmeng | $274,000 | Chicago Title Co |
Source: Public Records
Mortgage History
| Date | Status | Borrower | Loan Amount |
|---|---|---|---|
| Open | Lee Yewmeng | $409,000 | |
| Closed | Lee Yewmeng | $320,000 | |
| Previous Owner | Lee Yewmeng | $178,100 |
Source: Public Records
Tax History Compared to Growth
Tax History
| Year | Tax Paid | Tax Assessment Tax Assessment Total Assessment is a certain percentage of the fair market value that is determined by local assessors to be the total taxable value of land and additions on the property. | Land | Improvement |
|---|---|---|---|---|
| 2025 | $4,405 | $412,876 | $144,506 | $268,370 |
| 2024 | $4,405 | $404,781 | $141,673 | $263,108 |
| 2023 | $4,304 | $396,844 | $138,895 | $257,949 |
| 2022 | $4,292 | $389,063 | $136,172 | $252,891 |
| 2021 | $4,289 | $381,434 | $133,502 | $247,932 |
| 2020 | $4,112 | $377,523 | $132,133 | $245,390 |
| 2019 | $4,158 | $370,120 | $129,542 | $240,578 |
| 2018 | $4,063 | $362,863 | $127,002 | $235,861 |
| 2017 | $3,877 | $355,748 | $124,512 | $231,236 |
| 2016 | $3,770 | $348,773 | $122,071 | $226,702 |
| 2015 | $3,745 | $343,534 | $120,237 | $223,297 |
| 2014 | $3,638 | $336,805 | $117,882 | $218,923 |
Source: Public Records
Map
Nearby Homes
- 8010 Rosebud St
- 7950 Gardenia Ave
- 5800 Ridgeway Rd
- 6087 Aquamarine Ave
- 7931 Beechwood Dr
- 8291 Jennet St
- 880 E 24th St
- 6114 Sard St
- 6113 Sard St
- 2421 Cliff Rd
- 6073 Cameo St
- 477 Paxton Ct
- 8309 Hillside Rd
- 2479 Cliff Rd
- 2487 Cliff Rd
- 6165 Hollyoak Dr
- 6254 Hollyoak Dr
- 2501 Cliff Rd
- 2464 Prospect Dr
- 275 E 24th St
- 7967 Rosebud St
- 7958 Rosebud St
- 7981 Rosebud St
- 7962 Rosebud St
- 6040 Indigo Ave
- 7968 Rosebud St
- 7993 Rosebud St
- 7982 Rosebud St
- 6041 Indigo Ave
- 6046 Indigo Ave
- 8007 Rosebud St
- 7994 Rosebud St
- 6056 Indigo Ave
- 8021 Rosebud St
- 7945 Gardenia Ave
- 6047 Indigo Ave
- 7957 Gardenia Ave
- 7973 Gardenia Ave
- 7985 Gardenia Ave
- 8024 Rosebud St