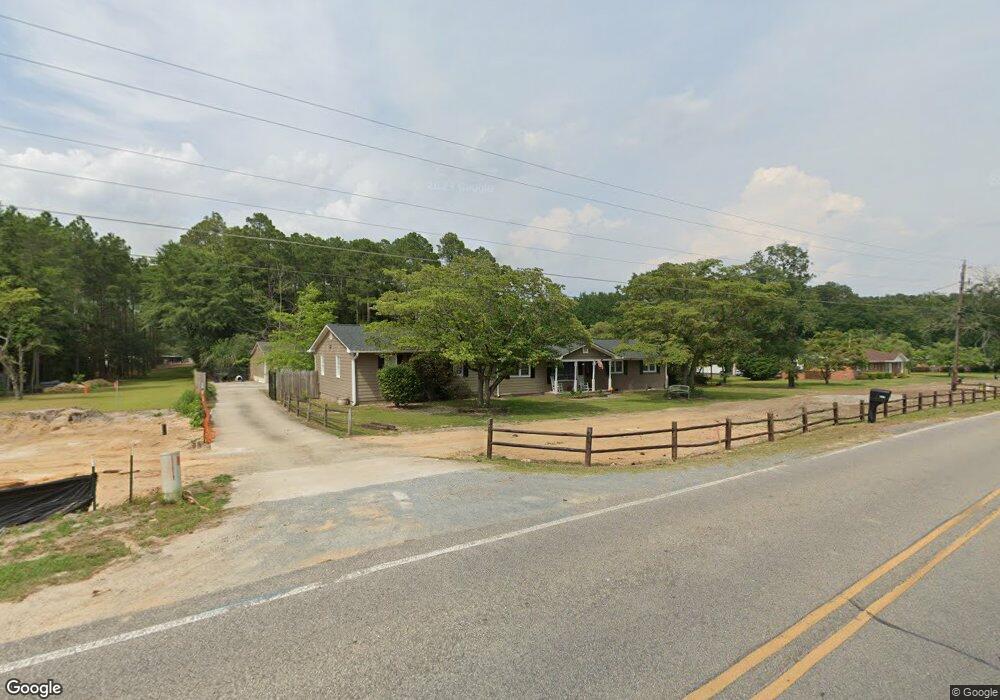
7958 King Rd Fayetteville, NC 28306
Jack Britt NeighborhoodEstimated Value: $238,000 - $362,000
3
Beds
2
Baths
2,331
Sq Ft
$134/Sq Ft
Est. Value
About This Home
This home is located at 7958 King Rd, Fayetteville, NC 28306 and is currently estimated at $312,228, approximately $133 per square foot. 7958 King Rd is a home located in Cumberland County with nearby schools including Stoney Point Elementary School, John R. Griffin Middle School, and Liberty Christian Academy.
Ownership History
Date
Name
Owned For
Owner Type
Purchase Details
Closed on
Jun 3, 2021
Sold by
Tolliver Sharon Dhene and Middleton Sharon Dhene
Bought by
Middleton James John
Current Estimated Value
Purchase Details
Closed on
Apr 9, 2003
Sold by
Bank One
Bought by
Middleton James
Home Financials for this Owner
Home Financials are based on the most recent Mortgage that was taken out on this home.
Original Mortgage
$74,575
Interest Rate
5.74%
Mortgage Type
New Conventional
Create a Home Valuation Report for This Property
The Home Valuation Report is an in-depth analysis detailing your home's value as well as a comparison with similar homes in the area
Home Values in the Area
Average Home Value in this Area
Purchase History
| Date | Buyer | Sale Price | Title Company |
|---|---|---|---|
| Middleton James John | $25,000 | None Available | |
| Middleton James | $78,500 | -- |
Source: Public Records
Mortgage History
| Date | Status | Borrower | Loan Amount |
|---|---|---|---|
| Previous Owner | Middleton James | $74,575 |
Source: Public Records
Tax History Compared to Growth
Tax History
| Year | Tax Paid | Tax Assessment Tax Assessment Total Assessment is a certain percentage of the fair market value that is determined by local assessors to be the total taxable value of land and additions on the property. | Land | Improvement |
|---|---|---|---|---|
| 2024 | $3,853 | $187,827 | $37,500 | $150,327 |
| 2023 | $3,061 | $187,827 | $37,500 | $150,327 |
| 2022 | $2,776 | $187,827 | $37,500 | $150,327 |
| 2021 | $2,776 | $187,827 | $37,500 | $150,327 |
| 2019 | $2,741 | $186,600 | $37,500 | $149,100 |
| 2018 | $2,741 | $186,600 | $37,500 | $149,100 |
| 2017 | $2,638 | $186,600 | $37,500 | $149,100 |
| 2016 | $2,239 | $169,600 | $19,600 | $150,000 |
| 2015 | $2,216 | $169,600 | $19,600 | $150,000 |
| 2014 | $2,209 | $169,600 | $19,600 | $150,000 |
Source: Public Records
Map
Nearby Homes