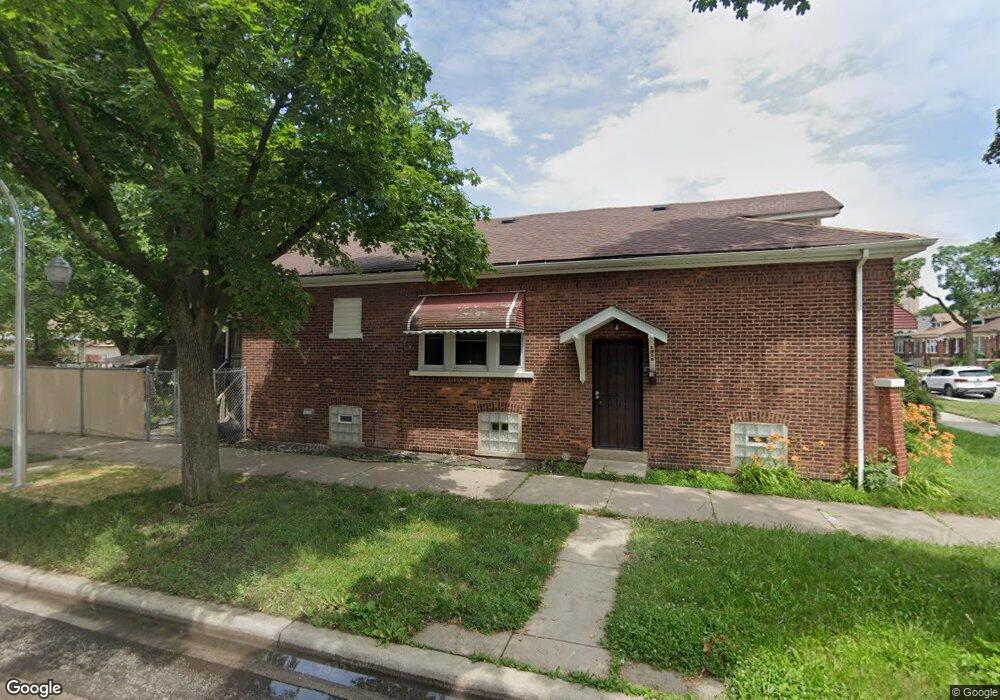
7958 S Kenwood Ave Chicago, IL 60619
Grand Crossing NeighborhoodEstimated Value: $91,000 - $203,000
3
Beds
1
Bath
1,104
Sq Ft
$150/Sq Ft
Est. Value
About This Home
This home is located at 7958 S Kenwood Ave, Chicago, IL 60619 and is currently estimated at $165,165, approximately $149 per square foot. 7958 S Kenwood Ave is a home located in Cook County with nearby schools including Emil G. Hirsch Metropolitan High School, Betty Shabazz Academy, and CICS Avalon.
Ownership History
Date
Name
Owned For
Owner Type
Purchase Details
Closed on
Oct 15, 2008
Sold by
Emc Mortgage Corporation
Bought by
Green 7000 Properties Llc
Current Estimated Value
Purchase Details
Closed on
Sep 4, 2008
Sold by
Robertson Gregory
Bought by
Emc Mortgage Corp
Purchase Details
Closed on
Feb 10, 2006
Sold by
Yeboah Richard
Bought by
Robertson Gregory
Home Financials for this Owner
Home Financials are based on the most recent Mortgage that was taken out on this home.
Original Mortgage
$172,000
Interest Rate
8.89%
Mortgage Type
Unknown
Purchase Details
Closed on
Apr 29, 2005
Sold by
Taylor Mary Etta
Bought by
Yeboah Richard
Home Financials for this Owner
Home Financials are based on the most recent Mortgage that was taken out on this home.
Original Mortgage
$121,500
Interest Rate
7.9%
Mortgage Type
Fannie Mae Freddie Mac
Create a Home Valuation Report for This Property
The Home Valuation Report is an in-depth analysis detailing your home's value as well as a comparison with similar homes in the area
Home Values in the Area
Average Home Value in this Area
Purchase History
| Date | Buyer | Sale Price | Title Company |
|---|---|---|---|
| Green 7000 Properties Llc | $34,000 | 1St American Title | |
| Emc Mortgage Corp | -- | None Available | |
| Robertson Gregory | $215,000 | Lawyers Title Insurance Corp | |
| Yeboah Richard | $135,000 | -- |
Source: Public Records
Mortgage History
| Date | Status | Borrower | Loan Amount |
|---|---|---|---|
| Previous Owner | Robertson Gregory | $172,000 | |
| Previous Owner | Yeboah Richard | $121,500 | |
| Closed | Yeboah Richard | $6,750 |
Source: Public Records
Tax History Compared to Growth
Tax History
| Year | Tax Paid | Tax Assessment Tax Assessment Total Assessment is a certain percentage of the fair market value that is determined by local assessors to be the total taxable value of land and additions on the property. | Land | Improvement |
|---|---|---|---|---|
| 2024 | $2,331 | $11,544 | $2,813 | $8,731 |
| 2023 | $2,272 | $11,047 | $4,688 | $6,359 |
| 2022 | $2,272 | $11,047 | $4,688 | $6,359 |
| 2021 | $2,221 | $11,046 | $4,687 | $6,359 |
| 2020 | $2,527 | $11,343 | $3,375 | $7,968 |
| 2019 | $2,532 | $12,604 | $3,375 | $9,229 |
| 2018 | $2,490 | $12,604 | $3,375 | $9,229 |
| 2017 | $2,691 | $12,499 | $3,000 | $9,499 |
| 2016 | $2,503 | $12,499 | $3,000 | $9,499 |
| 2015 | $2,290 | $12,499 | $3,000 | $9,499 |
| 2014 | $2,221 | $11,973 | $2,625 | $9,348 |
| 2013 | $2,178 | $11,973 | $2,625 | $9,348 |
Source: Public Records
Map
Nearby Homes
- 8007 S Avalon Ave
- 7839 S Kimbark Ave
- 8055 S Avalon Ave
- 8101 S Kimbark Ave
- 8048 S Avalon Ave
- 8005 S Blackstone Ave
- 7930 S Anthony Ave
- 8035 S Blackstone Ave
- 7948 S Anthony Ave
- 8041 S Blackstone Ave
- 1130 E 81st St Unit A
- 1129 E 81st St
- 1059 E 80th St
- 8106 S Harper Ave
- 8138 S Harper Ave
- 8227 S Avalon Ave
- 7948 S Dobson Ave
- 7928 S Dobson Ave
- 7642 S Dante Ave
- 8036 S Dobson Ave
- 7954 S Kenwood Ave
- 7952 S Kenwood Ave
- 7948 S Kenwood Ave
- 8000 S Kenwood Ave
- 7944 S Kenwood Ave
- 8004 S Kenwood Ave
- 1302 E 80th St
- 1302 E 80th St
- 7951 S Kimbark Ave
- 7942 S Kenwood Ave
- 8006 S Kenwood Ave
- 7947 S Kimbark Ave
- 8001 S Kimbark Ave
- 7945 S Kimbark Ave
- 7938 S Kenwood Ave
- 8010 S Kenwood Ave
- 8005 S Kimbark Ave
- 7957 S Kenwood Ave
- 7955 S Kenwood Ave
- 7941 S Kimbark Ave