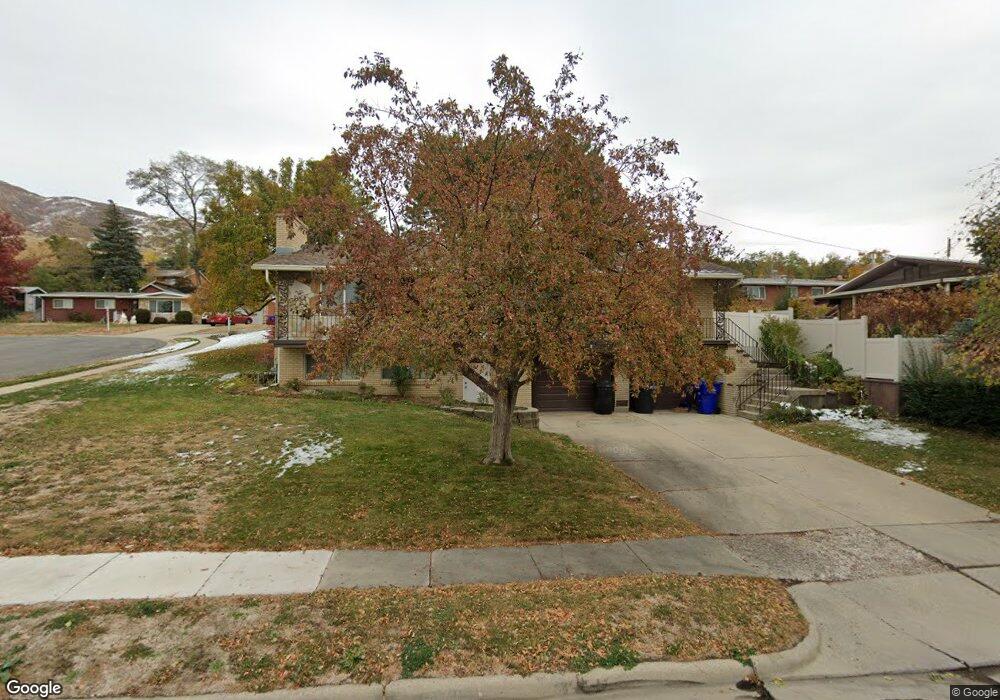
796 N 800 E Bountiful, UT 84010
Estimated Value: $526,729 - $588,000
3
Beds
3
Baths
1,961
Sq Ft
$286/Sq Ft
Est. Value
About This Home
This home is located at 796 N 800 E, Bountiful, UT 84010 and is currently estimated at $560,432, approximately $285 per square foot. 796 N 800 E is a home located in Davis County with nearby schools including Holbrook Elementary School, Bountiful Junior High School, and Bountiful High School.
Ownership History
Date
Name
Owned For
Owner Type
Purchase Details
Closed on
Apr 15, 2010
Sold by
Larson Marylynne
Bought by
Larson Marylynne and The Evergreen Larson 2009 Revocable Livi
Current Estimated Value
Purchase Details
Closed on
Jun 8, 2009
Sold by
Griffiths Dean M and Griffiths Rachel J
Bought by
Larson Marylynne
Purchase Details
Closed on
Aug 27, 1999
Sold by
Simon Ross E and Simon Teresa D
Bought by
Griffiths Dean M and Griffiths Rachel J
Home Financials for this Owner
Home Financials are based on the most recent Mortgage that was taken out on this home.
Original Mortgage
$145,540
Interest Rate
7.56%
Create a Home Valuation Report for This Property
The Home Valuation Report is an in-depth analysis detailing your home's value as well as a comparison with similar homes in the area
Purchase History
| Date | Buyer | Sale Price | Title Company |
|---|---|---|---|
| Larson Marylynne | -- | Aspen Title Insurance A | |
| Larson Marylynne | -- | Aspen Title Insurance Agency | |
| Griffiths Dean M | -- | Bonneville Title Company Inc |
Source: Public Records
Mortgage History
| Date | Status | Borrower | Loan Amount |
|---|---|---|---|
| Previous Owner | Griffiths Dean M | $145,540 |
Source: Public Records
Tax History
| Year | Tax Paid | Tax Assessment Tax Assessment Total Assessment is a certain percentage of the fair market value that is determined by local assessors to be the total taxable value of land and additions on the property. | Land | Improvement |
|---|---|---|---|---|
| 2025 | $2,939 | $267,850 | $114,863 | $152,987 |
| 2024 | $2,518 | $260,699 | $105,498 | $155,201 |
| 2023 | $2,640 | $249,150 | $103,849 | $145,300 |
| 2022 | $2,793 | $479,000 | $182,186 | $296,814 |
| 2021 | $2,394 | $344,000 | $148,721 | $195,279 |
| 2020 | $2,111 | $304,000 | $135,473 | $168,527 |
| 2019 | $2,138 | $301,000 | $138,997 | $162,003 |
| 2018 | $1,960 | $271,000 | $127,606 | $143,394 |
| 2016 | $1,593 | $118,690 | $38,774 | $79,916 |
| 2015 | $1,627 | $110,605 | $38,774 | $71,831 |
| 2014 | $1,608 | $116,803 | $38,774 | $78,029 |
| 2013 | -- | $106,547 | $40,746 | $65,801 |
Source: Public Records
Map
Nearby Homes
- 1023 E 800 N
- 975 E 1050 N
- 662 E 1200 N
- 1105 E 600 N
- 908 Northern Hills Dr Unit 3
- 933 Northern Hills Cir
- 683 E 100 N
- 345 N 400 E
- 453 N 400 E Unit 7-D
- 1342 Northridge Dr
- 610 E Pages Ln
- 1138 Briggs Dr
- 1342 E Skyline Dr N Unit 30
- 1420 N Main St
- 49 E 200 N Unit 4
- 41 E 200 N Unit 6
- 55 E 200 N Unit 2
- 51 E 200 N Unit 3
- 256 N Main St
- 254 N Main St
Your Personal Tour Guide
Ask me questions while you tour the home.