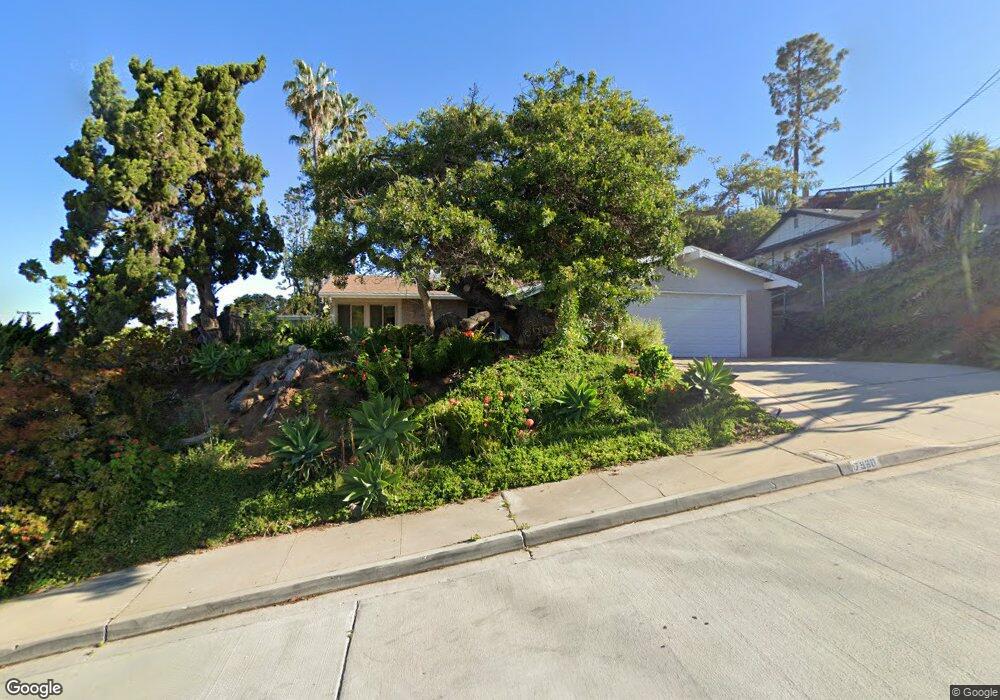
7960 Wetherley St La Mesa, CA 91941
Estimated Value: $1,087,526 - $1,155,000
4
Beds
2
Baths
1,995
Sq Ft
$557/Sq Ft
Est. Value
About This Home
This home is located at 7960 Wetherley St, La Mesa, CA 91941 and is currently estimated at $1,111,632, approximately $557 per square foot. 7960 Wetherley St is a home located in San Diego County with nearby schools including La Mesa Arts Academy, La Mesa Dale Elementary School, and Mount Miguel High School.
Ownership History
Date
Name
Owned For
Owner Type
Purchase Details
Closed on
Nov 21, 2008
Sold by
Moody Barbara A and Jenkins Donald L
Bought by
Smith Kevin and Smith Tiffany
Current Estimated Value
Home Financials for this Owner
Home Financials are based on the most recent Mortgage that was taken out on this home.
Original Mortgage
$453,197
Outstanding Balance
$297,783
Interest Rate
6.1%
Mortgage Type
FHA
Estimated Equity
$813,849
Purchase Details
Closed on
Mar 7, 2007
Sold by
Moody Barbara A
Bought by
Moody Barbara A and Jenkins Donald L
Purchase Details
Closed on
Aug 2, 2005
Sold by
Jenkins William E
Bought by
Jenkins William E
Home Financials for this Owner
Home Financials are based on the most recent Mortgage that was taken out on this home.
Original Mortgage
$579,078
Interest Rate
5.81%
Mortgage Type
Reverse Mortgage Home Equity Conversion Mortgage
Create a Home Valuation Report for This Property
The Home Valuation Report is an in-depth analysis detailing your home's value as well as a comparison with similar homes in the area
Purchase History
| Date | Buyer | Sale Price | Title Company |
|---|---|---|---|
| Smith Kevin | $470,000 | Southland Title Of San Diego | |
| Moody Barbara A | -- | None Available | |
| Jenkins William E | -- | Alliance Title Company |
Source: Public Records
Mortgage History
| Date | Status | Borrower | Loan Amount |
|---|---|---|---|
| Open | Smith Kevin | $453,197 | |
| Previous Owner | Jenkins William E | $579,078 |
Source: Public Records
Tax History
| Year | Tax Paid | Tax Assessment Tax Assessment Total Assessment is a certain percentage of the fair market value that is determined by local assessors to be the total taxable value of land and additions on the property. | Land | Improvement |
|---|---|---|---|---|
| 2025 | $8,000 | $605,225 | $257,541 | $347,684 |
| 2024 | $8,000 | $593,359 | $252,492 | $340,867 |
| 2023 | $7,766 | $581,726 | $247,542 | $334,184 |
| 2022 | $7,660 | $570,321 | $242,689 | $327,632 |
| 2021 | $7,545 | $559,139 | $237,931 | $321,208 |
| 2020 | $7,337 | $553,407 | $235,492 | $317,915 |
| 2019 | $7,198 | $542,557 | $230,875 | $311,682 |
| 2018 | $7,113 | $531,920 | $226,349 | $305,571 |
| 2017 | $50 | $521,491 | $221,911 | $299,580 |
| 2016 | $6,764 | $511,266 | $217,560 | $293,706 |
| 2015 | $6,706 | $503,588 | $214,293 | $289,295 |
| 2014 | $6,461 | $493,725 | $210,096 | $283,629 |
Source: Public Records
Map
Nearby Homes
- 8010 Wetherly St
- 4050 Rosarita Dr
- 4303 Sheldon Dr
- 4221 Cobalt Dr
- 0 Eastridge Dr Unit WS21258579
- 4258 Summit Dr
- 7790 La Mesa Summit Dr
- 7520 High St Unit 28-30
- 7760 La Mesa Summit Dr
- 7795 La Mesa Summit Dr
- 8022 High St
- 7765 La Mesa Summit Dr
- 7810 La Mesa Summit Dr
- 3812 Costa Bella Way
- 4515 Acacia Ave
- 8050-52 Lemon Grove Way
- 7861 Quince St
- 8260-62 Pasadena Ave
- 8186 Lemon Grove Way Unit E
- 8146 Lemon Grove Way Unit B
- 7950 Wetherley St
- 7970 Wetherley St
- 7987 Cinnabar Dr
- 7981 Cinnabar Dr
- 7940 Wetherley St
- 4100 Hurley Dr
- 7980 Wetherley St
- 7995 Cinnabar Dr
- 7967 Wetherley St
- 4120 Hurley Dr
- 7977 Cinnabar Dr
- 7930 Wetherley St
- 8015 Cinnabar Dr
- 7957 Wetherley St
- 7930 Wetherly St
- 7977 Wetherley St
- 4115 Hurley Dr
- 8000 Wetherley St
- 7971 Cinnabar Dr
- 7947 Wetherley St
Your Personal Tour Guide
Ask me questions while you tour the home.