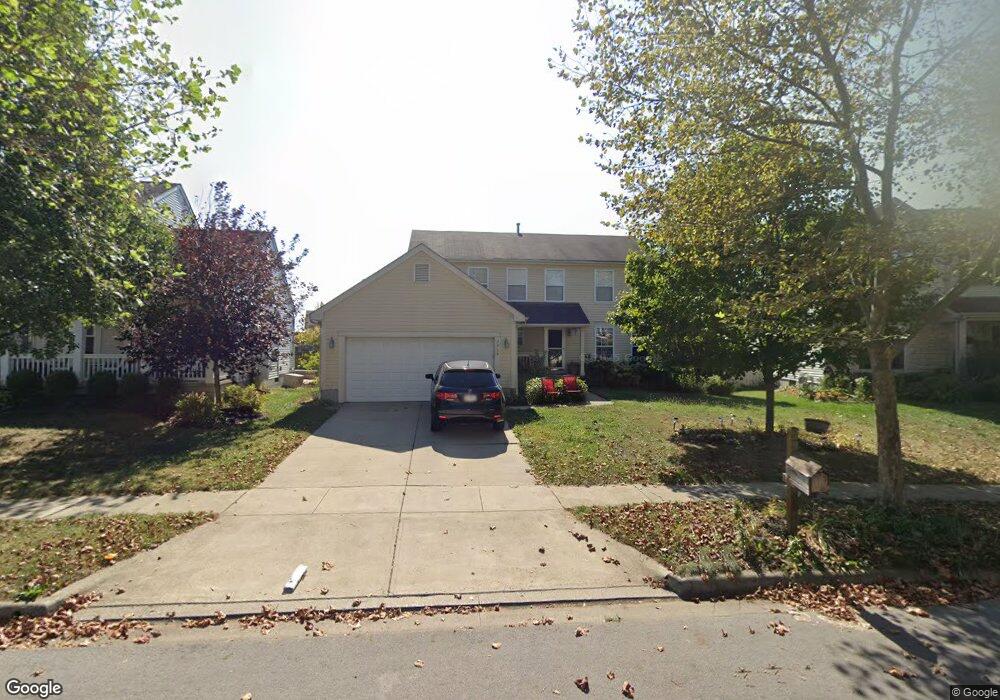
7966 Lazelle Woods Dr Westerville, OH 43081
Worthington Park NeighborhoodEstimated Value: $486,803 - $515,000
4
Beds
3
Baths
2,364
Sq Ft
$212/Sq Ft
Est. Value
About This Home
This home is located at 7966 Lazelle Woods Dr, Westerville, OH 43081 and is currently estimated at $500,201, approximately $211 per square foot. 7966 Lazelle Woods Dr is a home located in Franklin County with nearby schools including Worthington Park Elementary School, Worthingway Middle School, and Thomas Worthington High School.
Ownership History
Date
Name
Owned For
Owner Type
Purchase Details
Closed on
May 22, 2008
Sold by
Potter Vicki I and Potter Douglas S
Bought by
Hanna Sabry and Farag Sanna
Current Estimated Value
Home Financials for this Owner
Home Financials are based on the most recent Mortgage that was taken out on this home.
Original Mortgage
$232,750
Outstanding Balance
$147,784
Interest Rate
5.93%
Mortgage Type
Purchase Money Mortgage
Estimated Equity
$352,417
Purchase Details
Closed on
Dec 15, 2005
Sold by
Potter Douglas S and Potter Vicki I
Bought by
Potter Vicki I and Potter Douglas S
Purchase Details
Closed on
Sep 13, 2004
Sold by
Trinity Home Builders Inc
Bought by
Potter Douglas S and Potter Vicki I
Home Financials for this Owner
Home Financials are based on the most recent Mortgage that was taken out on this home.
Original Mortgage
$205,400
Interest Rate
4.12%
Mortgage Type
Purchase Money Mortgage
Create a Home Valuation Report for This Property
The Home Valuation Report is an in-depth analysis detailing your home's value as well as a comparison with similar homes in the area
Home Values in the Area
Average Home Value in this Area
Purchase History
| Date | Buyer | Sale Price | Title Company |
|---|---|---|---|
| Hanna Sabry | $245,000 | Talon Group | |
| Potter Vicki I | -- | -- | |
| Potter Douglas S | $256,800 | -- |
Source: Public Records
Mortgage History
| Date | Status | Borrower | Loan Amount |
|---|---|---|---|
| Open | Hanna Sabry | $232,750 | |
| Previous Owner | Potter Douglas S | $205,400 |
Source: Public Records
Tax History Compared to Growth
Tax History
| Year | Tax Paid | Tax Assessment Tax Assessment Total Assessment is a certain percentage of the fair market value that is determined by local assessors to be the total taxable value of land and additions on the property. | Land | Improvement |
|---|---|---|---|---|
| 2024 | $9,012 | $146,790 | $35,000 | $111,790 |
| 2023 | $8,618 | $146,790 | $35,000 | $111,790 |
| 2022 | $6,954 | $93,980 | $18,900 | $75,080 |
| 2021 | $6,415 | $93,980 | $18,900 | $75,080 |
| 2020 | $6,179 | $93,980 | $18,900 | $75,080 |
| 2019 | $5,712 | $78,400 | $15,750 | $62,650 |
| 2018 | $5,438 | $78,400 | $15,750 | $62,650 |
| 2017 | $5,119 | $78,400 | $15,750 | $62,650 |
| 2016 | $5,340 | $75,220 | $24,150 | $51,070 |
| 2015 | $5,341 | $75,220 | $24,150 | $51,070 |
| 2014 | $5,339 | $75,220 | $24,150 | $51,070 |
| 2013 | $2,657 | $75,215 | $24,150 | $51,065 |
Source: Public Records
Map
Nearby Homes
- 1192 Blacksmith Dr
- 7916 Sudeley Ct
- 7852 Heathcock Ct
- 1296 Blacksmith Dr
- 8158 Newark Ave Unit 16E
- 1133 Tillicum Dr
- 1193 Hollytree Ln Unit 1193
- 1143 Green Knoll Dr Unit 1143
- 1026 Snohomish Ave
- 1291 Worthington Creek Dr Unit 7
- 1113 Green Knoll Dr Unit 1113
- 902 Upholland Ln Unit 17A
- 874 Charnwood Ln Unit 5D
- 8193 Charlotte Way Ave Unit 19B
- 8321 Sable Crossing Dr
- 874 Sheldrake Ct Unit 21C
- 842 Soramill Ln Unit 46C
- 7685 Whitneyway Dr Unit 17
- 7889 Woodhouse Ln Unit 44B
- 7691 Key Deer Dr
- 7974 Lazelle Woods Dr
- 7958 Lazelle Woods Dr
- 7982 Lazelle Woods Dr
- 1280 Freshman Dr
- 7950 Lazelle Woods Dr
- 1264 Freshman Dr
- 1272 Freshman Dr
- 1256 Freshman Dr
- 1288 Freshman Dr
- 1248 Freshman Dr
- 7973 Lazelle Woods Dr
- 7990 Lazelle Woods Dr
- 7957 Lazelle Woods Dr
- 1294 Freshman Dr
- 7981 Lazelle Woods Dr
- 7942 Lazelle Woods Dr
- 1240 Freshman Dr
- 7989 Lazelle Woods Dr
- 7945 Lazelle Woods Dr
- 7998 Lazelle Woods Dr