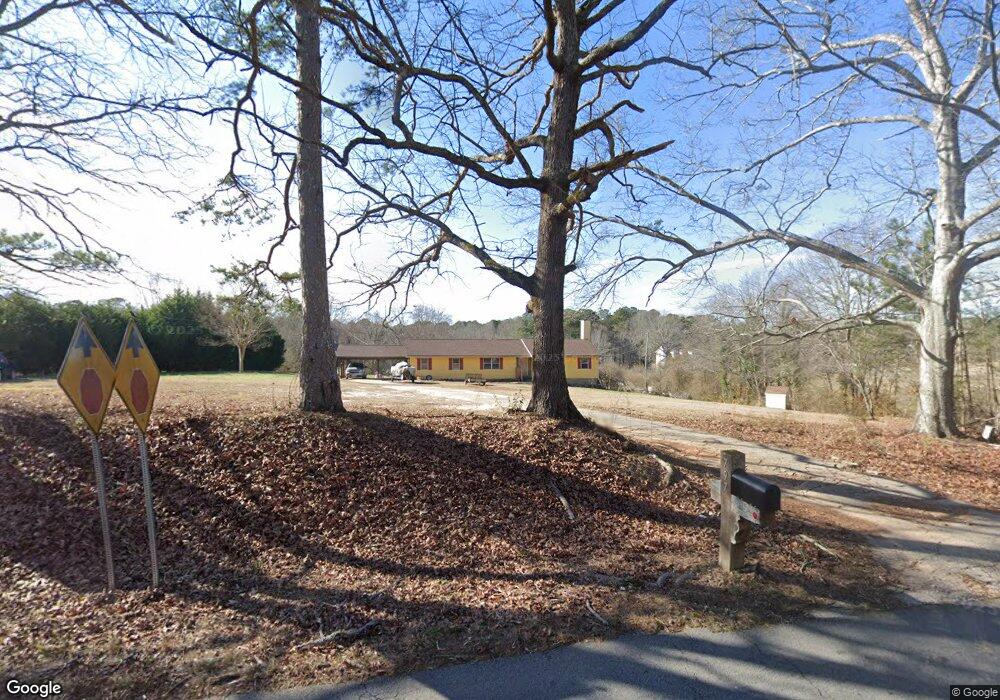
797 Clarence Edwards Rd Bethlehem, GA 30620
Estimated Value: $330,999 - $352,000
3
Beds
2
Baths
1,520
Sq Ft
$227/Sq Ft
Est. Value
About This Home
This home is located at 797 Clarence Edwards Rd, Bethlehem, GA 30620 and is currently estimated at $345,500, approximately $227 per square foot. 797 Clarence Edwards Rd is a home located in Barrow County with nearby schools including Yargo Elementary School, Haymon-Morris Middle School, and Apalachee High School.
Ownership History
Date
Name
Owned For
Owner Type
Purchase Details
Closed on
Aug 31, 2011
Sold by
Secretary Of Housing And U
Bought by
Xiong Chi Kong
Current Estimated Value
Home Financials for this Owner
Home Financials are based on the most recent Mortgage that was taken out on this home.
Original Mortgage
$110,673
Outstanding Balance
$76,293
Interest Rate
4.4%
Mortgage Type
New Conventional
Estimated Equity
$269,207
Purchase Details
Closed on
Dec 7, 2010
Sold by
Wells Fargo Bk Na
Bought by
Hud-Housing Of Urban Dev
Purchase Details
Closed on
Mar 11, 2010
Sold by
Mercado Ruben
Bought by
Mercado Ruben
Purchase Details
Closed on
Oct 15, 2002
Sold by
Mercado Ruben
Bought by
Mercado Ruben
Purchase Details
Closed on
May 24, 1999
Sold by
Pittman Bertha
Bought by
Mercado Ruben
Home Financials for this Owner
Home Financials are based on the most recent Mortgage that was taken out on this home.
Original Mortgage
$120,010
Interest Rate
6.9%
Mortgage Type
New Conventional
Create a Home Valuation Report for This Property
The Home Valuation Report is an in-depth analysis detailing your home's value as well as a comparison with similar homes in the area
Home Values in the Area
Average Home Value in this Area
Purchase History
| Date | Buyer | Sale Price | Title Company |
|---|---|---|---|
| Xiong Chi Kong | $103,000 | -- | |
| Hud-Housing Of Urban Dev | -- | -- | |
| Wells Fargo Bk Na | $137,400 | -- | |
| Mercado Ruben | -- | -- | |
| Mercado Ruben | -- | -- | |
| Mercado Ruben | $121,000 | -- |
Source: Public Records
Mortgage History
| Date | Status | Borrower | Loan Amount |
|---|---|---|---|
| Open | Xiong Chi Kong | $110,673 | |
| Previous Owner | Mercado Ruben | $120,010 |
Source: Public Records
Tax History Compared to Growth
Tax History
| Year | Tax Paid | Tax Assessment Tax Assessment Total Assessment is a certain percentage of the fair market value that is determined by local assessors to be the total taxable value of land and additions on the property. | Land | Improvement |
|---|---|---|---|---|
| 2024 | $2,016 | $81,324 | $18,000 | $63,324 |
| 2023 | $2,005 | $81,324 | $18,000 | $63,324 |
| 2022 | $1,476 | $51,029 | $13,148 | $37,881 |
| 2021 | $1,555 | $51,029 | $13,148 | $37,881 |
| 2020 | $1,599 | $52,344 | $14,463 | $37,881 |
| 2019 | $1,526 | $49,009 | $14,463 | $34,546 |
| 2018 | $1,506 | $49,009 | $14,463 | $34,546 |
| 2017 | $1,299 | $44,600 | $14,463 | $30,137 |
| 2016 | $1,375 | $44,996 | $14,463 | $30,534 |
| 2015 | $1,393 | $45,393 | $14,463 | $30,930 |
| 2014 | $1,222 | $38,413 | $7,087 | $31,326 |
| 2013 | -- | $37,410 | $7,086 | $30,323 |
Source: Public Records
Map
Nearby Homes
- 758 Clarence Edwards Rd
- 190 Lokeys Ln
- 303 Ron Dr
- 0 Jb Owens Unit 7552902
- 0 Jb Owens Unit 7552891
- 0 Jb Owens Unit LOT 2 - 2.09 ACRES
- 0 Jb Owens Unit LOT 3 - 2.01 ACRES
- 209 Angie Way
- 575 Mackinaw Dr
- 1111 Otis Dr
- 1129 Loganville Hwy
- 236 Vision St
- 176 Market St
- 14 Smithwood Dr
- 755 Harry McCarty Rd
- 220 Carl Bethlehem Rd SW
- 1024 Lyndhurst Ln
- 763 Moss Side Dr
- 637 Sleeping Meadow Ln
- 0 Tanners Bridge Rd Unit 10588144
- 805 Clarence Edwards Rd
- 802 Clarence Edwards Rd
- 794 Clarence Edwards Rd
- 463 Harvey Lokey Rd
- 787 Clarence Edwards Rd
- 815 Clarence Edwards Rd
- 808 Clarence Edwards Rd
- 784 Clarence Edwards Rd
- 779 Clarence Edwards Rd
- 441 Harvey Lokey Rd
- 776 Clarence Edwards Rd
- 0 Emmett Rd Unit 8770186
- 775 Clarence Edwards Rd
- 401 Harvey Lokey Rd
- 493 Harvey Lokey Rd
- 454 Harvey Lokey Rd Unit 1
- 446 Harvey Lokey Rd
- 446 Harvey Lokey Rd Unit 2
- 442 Harvey Lokey Rd Unit 3
- 440 Harvey Lokey Rd