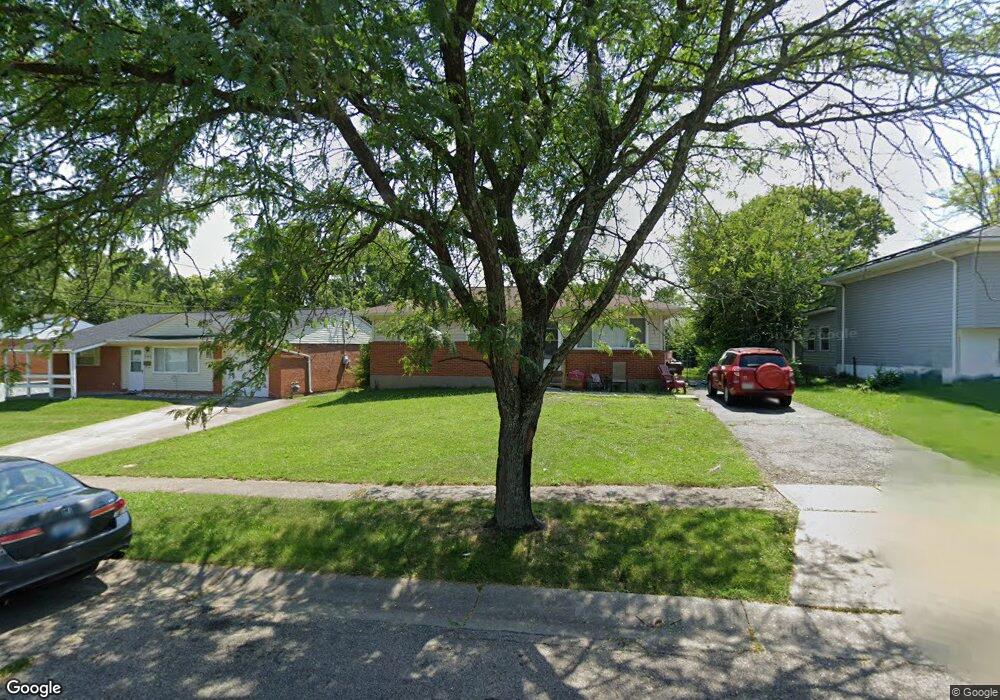
797 Hargrove Way Cincinnati, OH 45240
Estimated Value: $174,356 - $197,000
3
Beds
1
Bath
993
Sq Ft
$183/Sq Ft
Est. Value
About This Home
This home is located at 797 Hargrove Way, Cincinnati, OH 45240 and is currently estimated at $182,089, approximately $183 per square foot. 797 Hargrove Way is a home located in Hamilton County with nearby schools including Calvary Academy- The and St Gabriel Consolidated School.
Ownership History
Date
Name
Owned For
Owner Type
Purchase Details
Closed on
May 13, 2015
Sold by
Large Creek Llc
Bought by
Vbpart Borrower Llc
Current Estimated Value
Purchase Details
Closed on
Mar 23, 2011
Sold by
Secretary Of Housing & Urban Development
Bought by
Large Creek Llc
Purchase Details
Closed on
May 17, 2010
Sold by
Maxberry Sean and Maxberry Sean M
Bought by
Fifth Third Mortgage Company
Purchase Details
Closed on
May 12, 2010
Sold by
Fifth Third Mortgage Company
Bought by
Secretary Of Housing & Urban Development
Purchase Details
Closed on
Jun 4, 2004
Sold by
Olbeter Carla
Bought by
Maxberry Jeay
Home Financials for this Owner
Home Financials are based on the most recent Mortgage that was taken out on this home.
Original Mortgage
$81,700
Interest Rate
7.99%
Mortgage Type
Unknown
Create a Home Valuation Report for This Property
The Home Valuation Report is an in-depth analysis detailing your home's value as well as a comparison with similar homes in the area
Home Values in the Area
Average Home Value in this Area
Purchase History
| Date | Buyer | Sale Price | Title Company |
|---|---|---|---|
| Vbpart Borrower Llc | -- | Attorney | |
| Large Creek Llc | $35,100 | Attorney | |
| Fifth Third Mortgage Company | $120,745 | None Available | |
| Secretary Of Housing & Urban Development | -- | None Available | |
| Maxberry Jeay | $86,000 | -- |
Source: Public Records
Mortgage History
| Date | Status | Borrower | Loan Amount |
|---|---|---|---|
| Previous Owner | Maxberry Jeay | $81,700 |
Source: Public Records
Tax History Compared to Growth
Tax History
| Year | Tax Paid | Tax Assessment Tax Assessment Total Assessment is a certain percentage of the fair market value that is determined by local assessors to be the total taxable value of land and additions on the property. | Land | Improvement |
|---|---|---|---|---|
| 2024 | $2,379 | $39,267 | $9,405 | $29,862 |
| 2023 | $2,365 | $39,267 | $9,405 | $29,862 |
| 2022 | $2,186 | $27,531 | $7,483 | $20,048 |
| 2021 | $2,179 | $27,531 | $7,483 | $20,048 |
| 2020 | $2,152 | $27,531 | $7,483 | $20,048 |
| 2019 | $2,053 | $22,943 | $6,237 | $16,706 |
| 2018 | $2,056 | $22,943 | $6,237 | $16,706 |
| 2017 | $2,005 | $22,943 | $6,237 | $16,706 |
| 2016 | $241 | $2,660 | $2,282 | $378 |
| 2015 | $222 | $2,660 | $2,282 | $378 |
| 2014 | $205 | $2,660 | $2,282 | $378 |
| 2013 | $211 | $2,800 | $2,401 | $399 |
Source: Public Records
Map
Nearby Homes
- 755 Hanson Dr
- 11761 Hanover Rd
- 11649 Kenn Rd
- 11696 Hinkley Dr
- 967 Harrogate Ct
- 962 Harrogate Ct
- 692 W Kemper Rd
- 918 Glasgow Dr
- 11481 Fremantle Dr
- 11842 Hitchcock Dr
- 11866 Hitchcock Dr
- 659 W Kemper Rd
- 12069 Cantrell Dr
- 11442 Gresham Place
- 21 Aspen Ct
- 11435 Fitchburg Ln
- 12189 Kenn Rd
- 1119 Imprint Ln
- 3323 Devonian Dr
- 11233 Embassy Dr
- 801 Hargrove Way
- 791 Hargrove Way
- 805 Hargrove Way
- 785 Hargrove Way
- 776 Hanson Dr
- 770 Hanson Dr
- 782 Hanson Dr
- 766 Hanson Dr
- 794 Hargrove Way
- 798 Hargrove Way
- 781 Hargrove Way
- 11778 Hackett Dr
- 790 Hargrove Way
- 804 Hargrove Way
- 11774 Hackett Dr
- 760 Hanson Dr
- 784 Hargrove Way
- 808 Hargrove Way
- 777 Hargrove Way
- 780 Hargrove Way