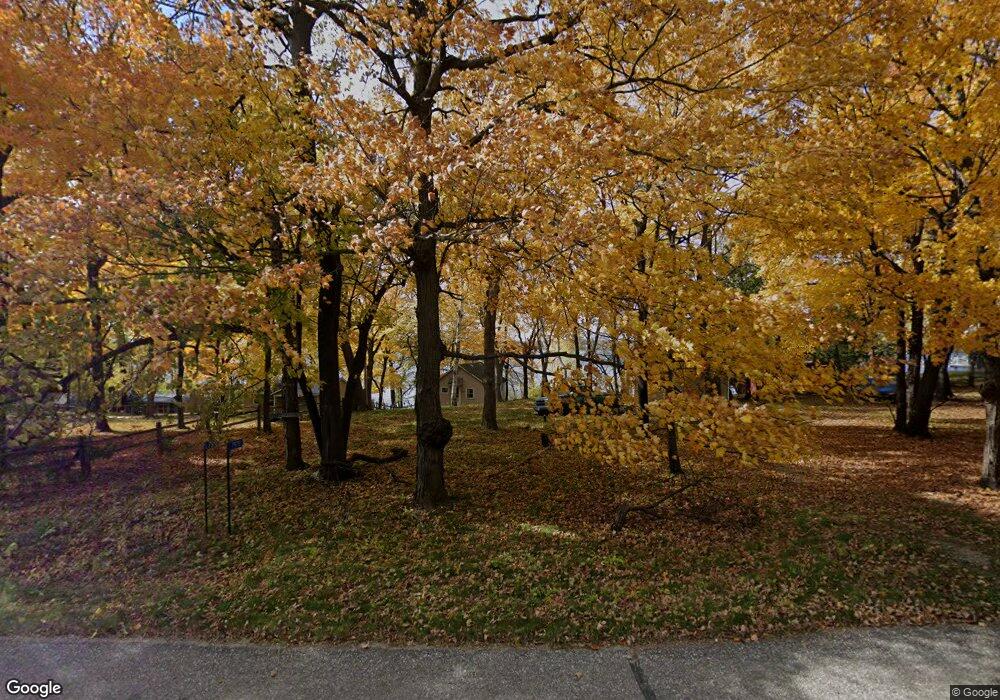
7970 E Lake Carlos Dr NE Unit NE Carlos, MN 56319
Estimated Value: $407,000 - $532,000
--
Bed
--
Bath
468
Sq Ft
$1,022/Sq Ft
Est. Value
About This Home
This home is located at 7970 E Lake Carlos Dr NE Unit NE, Carlos, MN 56319 and is currently estimated at $478,415, approximately $1,022 per square foot. 7970 E Lake Carlos Dr NE Unit NE is a home located in Douglas County with nearby schools including Carlos Elementary School, Discovery Middle School, and Alexandria Area High School.
Ownership History
Date
Name
Owned For
Owner Type
Purchase Details
Closed on
May 7, 2021
Sold by
Payee Central Diversifield Inc
Bought by
Tollefson Donna J
Current Estimated Value
Home Financials for this Owner
Home Financials are based on the most recent Mortgage that was taken out on this home.
Original Mortgage
$312,000
Outstanding Balance
$44,443
Interest Rate
3.1%
Mortgage Type
New Conventional
Estimated Equity
$433,972
Purchase Details
Closed on
Jul 10, 2007
Sold by
Tollefson Donna J
Bought by
Tollefson Everg Duane and Duane Tollefson E
Purchase Details
Closed on
Jun 2, 2006
Sold by
Tollefson Donna J and Duane Tollefson E
Bought by
Tollefson Propertries Llp
Purchase Details
Closed on
Mar 15, 2005
Sold by
Tollefson Eberg Duane and Tollefson Donna J
Bought by
Tollefson Eberg Duane and Tollefson Donna J
Create a Home Valuation Report for This Property
The Home Valuation Report is an in-depth analysis detailing your home's value as well as a comparison with similar homes in the area
Home Values in the Area
Average Home Value in this Area
Purchase History
| Date | Buyer | Sale Price | Title Company |
|---|---|---|---|
| Tollefson Donna J | $131,821 | None Available | |
| Sonstegard Griffin A | $258,178 | None Available | |
| Tollefson Everg Duane | -- | None Available | |
| Tollefson Propertries Llp | -- | None Available | |
| Tollefson Eberg Duane | -- | None Available |
Source: Public Records
Mortgage History
| Date | Status | Borrower | Loan Amount |
|---|---|---|---|
| Open | Sonstegard Griffin A | $312,000 |
Source: Public Records
Tax History Compared to Growth
Tax History
| Year | Tax Paid | Tax Assessment Tax Assessment Total Assessment is a certain percentage of the fair market value that is determined by local assessors to be the total taxable value of land and additions on the property. | Land | Improvement |
|---|---|---|---|---|
| 2025 | $3,014 | $440,000 | $440,000 | -- |
| 2024 | $3,014 | $442,900 | $424,000 | $18,900 |
| 2023 | $2,848 | $393,400 | $376,000 | $17,400 |
| 2022 | $2,370 | $320,400 | $304,000 | $16,400 |
| 2021 | $2,618 | $269,900 | $256,000 | $13,900 |
| 2020 | $2,652 | $277,400 | $259,300 | $18,100 |
| 2019 | $2,706 | $272,600 | $255,000 | $17,600 |
| 2018 | $2,668 | $263,700 | $246,500 | $17,200 |
| 2017 | $2,570 | $263,200 | $246,500 | $16,700 |
| 2016 | $2,740 | $255,013 | $239,105 | $15,908 |
| 2015 | $2,772 | $0 | $0 | $0 |
| 2014 | -- | $262,600 | $246,500 | $16,100 |
Source: Public Records
Map
Nearby Homes
- 7437 Sandhill Terrace NE
- xxx Emerald Ct NE
- 7148 County Road 42 NE
- 151 Woodsmen Dr NE
- 6451 Stardust Ln NE
- 151 Bluffs Rd NW
- 4974 Interlachen Dr NE
- XXXX County Road 34 NW
- 9220 County Road 34 NW
- Lot 3 Buckskin Park Ct NE
- 407 Main Ave
- 105 8th St W
- 18 N Douglas Ave
- 10250 County Road 34 NW
- 2691 Old County Road 120 NE
- 3877 Tolena Rd NE
- Lot 2 Buckskin Rd NE
- 2641 S Lake Miltona Dr NE Unit NE
- 3608 Tolena Rd NE
- 3731 Crestwood Ridge NE
- 8044 E Lake Carlos Dr NE
- 7954 E Lake Carlos Dr NE Unit NE
- 8070 E Lake Carlos Dr NE Unit NE
- 7926 E Lake Carlos Dr NE Unit NE
- 8086 E Lake Carlos Dr NE Unit NE
- 8100 E Lake Carlos Dr NE Unit NE
- 7935 E Lake Carlos Dr NE Unit NE
- 7910 E Lake Carlos Dr NE Unit NE
- 8061 E Lake Carlos Dr NE Unit NE
- 8093 E Lake Carlos Dr NE Unit NE
- 8102 E Lake Carlos Dr NE
- 8104 E Lake Carlos Dr NE
- 8111 E Lake Carlos Dr NE Unit NE
- 8111 E Lake Carlos Dr NE
- 8106 E Lake Carlos Dr NE
- 8106 E Lake Carlos Dr NE Unit NE
- 7909 E Lake Carlos Dr NE
- 7893 E Lake Carlos Dr NE
- 7876 E Lake Carlos Dr NE Unit NE
- 1915 Sandhill Ln NE