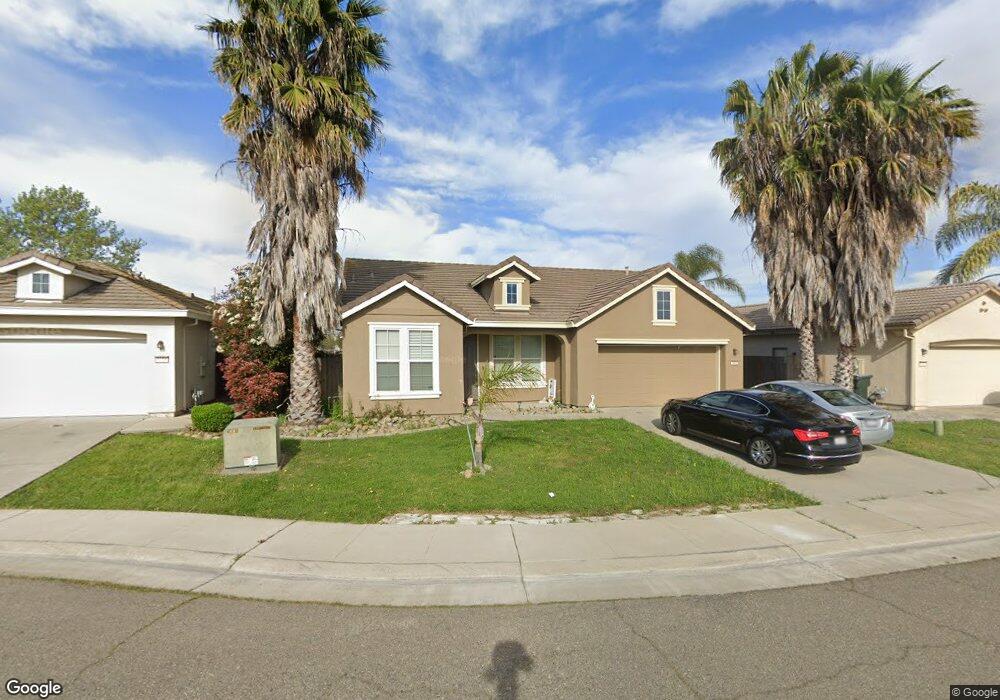
7970 Roseview Way Sacramento, CA 95828
Estimated Value: $181,000 - $530,000
3
Beds
2
Baths
1,567
Sq Ft
$266/Sq Ft
Est. Value
About This Home
This home is located at 7970 Roseview Way, Sacramento, CA 95828 and is currently estimated at $417,020, approximately $266 per square foot. 7970 Roseview Way is a home located in Sacramento County with nearby schools including Anna Kirchgater Elementary School, James Rutter Middle School, and Florin High School.
Ownership History
Date
Name
Owned For
Owner Type
Purchase Details
Closed on
Jan 31, 2011
Sold by
The Golden 1 Credit Union
Bought by
Shen Zhuang and Zhu Ping
Current Estimated Value
Home Financials for this Owner
Home Financials are based on the most recent Mortgage that was taken out on this home.
Original Mortgage
$120,000
Outstanding Balance
$82,152
Interest Rate
4.79%
Mortgage Type
New Conventional
Estimated Equity
$334,868
Purchase Details
Closed on
May 17, 2010
Sold by
Godinez Gerardo and Godinez Lisa C
Bought by
Golden 1 Credit Union
Purchase Details
Closed on
May 19, 2003
Sold by
Beazer Homes Holding Corp
Bought by
Godinez Gerardo and Godinez Lisa C
Home Financials for this Owner
Home Financials are based on the most recent Mortgage that was taken out on this home.
Original Mortgage
$232,886
Interest Rate
5.75%
Mortgage Type
FHA
Create a Home Valuation Report for This Property
The Home Valuation Report is an in-depth analysis detailing your home's value as well as a comparison with similar homes in the area
Home Values in the Area
Average Home Value in this Area
Purchase History
| Date | Buyer | Sale Price | Title Company |
|---|---|---|---|
| Shen Zhuang | $160,000 | Placer Title Company | |
| Golden 1 Credit Union | $200,000 | Accommodation | |
| Godinez Gerardo | $236,500 | First American Title Co |
Source: Public Records
Mortgage History
| Date | Status | Borrower | Loan Amount |
|---|---|---|---|
| Open | Shen Zhuang | $120,000 | |
| Previous Owner | Godinez Gerardo | $232,886 |
Source: Public Records
Tax History Compared to Growth
Tax History
| Year | Tax Paid | Tax Assessment Tax Assessment Total Assessment is a certain percentage of the fair market value that is determined by local assessors to be the total taxable value of land and additions on the property. | Land | Improvement |
|---|---|---|---|---|
| 2025 | $2,388 | $204,977 | $38,430 | $166,547 |
| 2024 | $2,388 | $200,959 | $37,677 | $163,282 |
| 2023 | $2,332 | $197,020 | $36,939 | $160,081 |
| 2022 | $2,295 | $193,158 | $36,215 | $156,943 |
| 2021 | $2,272 | $189,371 | $35,505 | $153,866 |
| 2020 | $2,244 | $187,430 | $35,141 | $152,289 |
| 2019 | $2,206 | $183,755 | $34,452 | $149,303 |
| 2018 | $2,151 | $180,153 | $33,777 | $146,376 |
| 2017 | $2,117 | $176,621 | $33,115 | $143,506 |
| 2016 | $2,018 | $173,159 | $32,466 | $140,693 |
| 2015 | $1,983 | $170,559 | $31,979 | $138,580 |
| 2014 | $1,953 | $167,219 | $31,353 | $135,866 |
Source: Public Records
Map
Nearby Homes
- 4.13 ACR Lenhart Rd
- 7711 Lenhart Rd
- 7901 Stevenson Ave
- 8016 Stevenson Ave
- 8095 E Stockton Blvd
- 0 Rangeview Ln
- 8077 Goran Ct
- 7905 Springarden Way
- 8045 Arroyo Vista Dr
- 8186 Gustine Way
- 8205 Weyburn Ct
- 7422 Sun Point Ln
- 8266 Summer Sunset Dr
- 8282 Union Creek Way
- 7724 La Bandera Way
- 8013 Skywoods Way
- 7956 Orchard Woods Cir
- 8346 Floxtree Ct
- 8336 Summer Sunset Dr
- 7407 Sunborough Ln
- 7966 Roseview Way
- 7974 Roseview Way
- 7962 Roseview Way
- 7971 Roseview Way
- 7978 Roseview Way
- 7967 Roseview Way
- 7982 Roseview Way
- 7958 Roseview Way
- 7986 Roseview Way
- 7959 Roseview Way
- 7954 Roseview Way
- 7911 Rangeview Rd
- 7917 Rangeview Rd
- 7976 Windgate Ct
- 7972 Windgate Ct
- 7923 Rangeview Rd
- 7990 Roseview Way
- 7968 Windgate Ct
- 7955 Roseview Way
- 7964 Windgate Ct