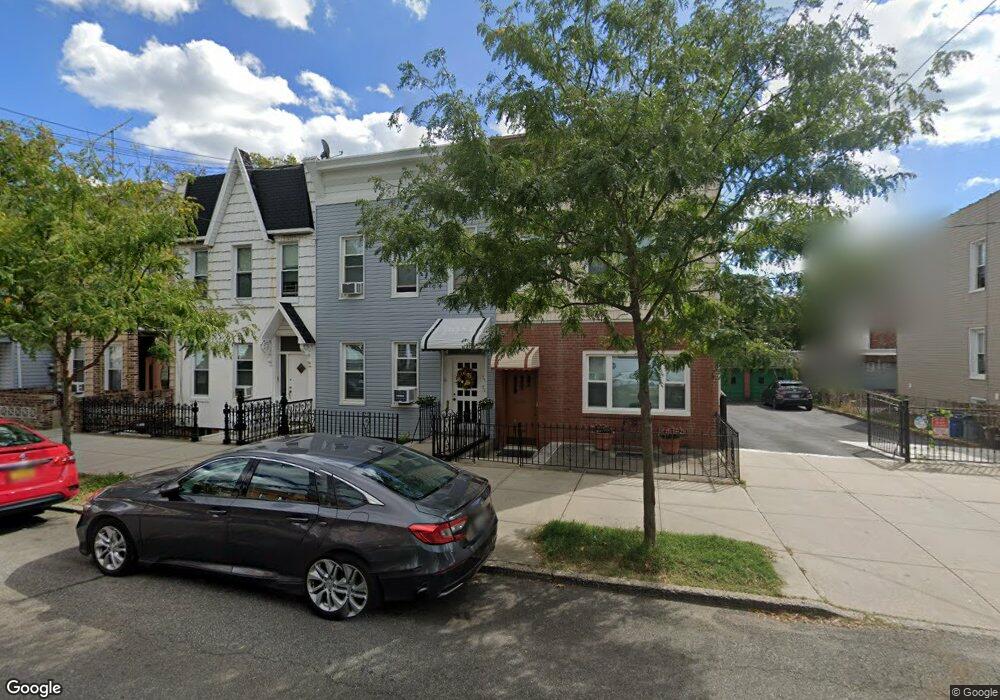
7972 78th Ave Glendale, NY 11385
Glendale NeighborhoodEstimated Value: $821,370 - $1,019,000
Studio
--
Bath
1,872
Sq Ft
$501/Sq Ft
Est. Value
About This Home
This home is located at 7972 78th Ave, Glendale, NY 11385 and is currently estimated at $938,593, approximately $501 per square foot. 7972 78th Ave is a home located in Queens County with nearby schools including I.S. 119 the Glendale and Elm Community Charter School.
Ownership History
Date
Name
Owned For
Owner Type
Purchase Details
Closed on
Nov 1, 2023
Sold by
Kelly Debra and The Lester And Barbara Van Cott Irrevoca
Bought by
Chanda Baishaki and Chandra Paul Manob
Current Estimated Value
Home Financials for this Owner
Home Financials are based on the most recent Mortgage that was taken out on this home.
Original Mortgage
$748,000
Outstanding Balance
$733,864
Interest Rate
7.57%
Mortgage Type
Purchase Money Mortgage
Estimated Equity
$204,729
Create a Home Valuation Report for This Property
The Home Valuation Report is an in-depth analysis detailing your home's value as well as a comparison with similar homes in the area
Home Values in the Area
Average Home Value in this Area
Purchase History
| Date | Buyer | Sale Price | Title Company |
|---|---|---|---|
| Chanda Baishaki | $880,000 | -- | |
| Chanda Baishaki | $880,000 | -- | |
| Chanda Baishaki | $880,000 | -- |
Source: Public Records
Mortgage History
| Date | Status | Borrower | Loan Amount |
|---|---|---|---|
| Open | Chanda Baishaki | $748,000 | |
| Closed | Chanda Baishaki | $748,000 |
Source: Public Records
Tax History
| Year | Tax Paid | Tax Assessment Tax Assessment Total Assessment is a certain percentage of the fair market value that is determined by local assessors to be the total taxable value of land and additions on the property. | Land | Improvement |
|---|---|---|---|---|
| 2025 | $5,480 | $29,549 | $6,881 | $22,668 |
| 2024 | $5,492 | $28,685 | $7,188 | $21,497 |
| 2023 | $5,480 | $28,685 | $6,374 | $22,311 |
| 2022 | $5,236 | $52,140 | $12,840 | $39,300 |
| 2021 | $5,197 | $43,200 | $12,840 | $30,360 |
| 2020 | $4,916 | $38,040 | $12,840 | $25,200 |
| 2019 | $4,708 | $32,580 | $12,840 | $19,740 |
| 2018 | $4,575 | $23,904 | $12,238 | $11,666 |
| 2017 | $4,400 | $23,056 | $11,501 | $11,555 |
| 2016 | $4,038 | $23,056 | $11,501 | $11,555 |
| 2015 | $2,471 | $20,520 | $14,280 | $6,240 |
| 2014 | $2,471 | $19,920 | $14,280 | $5,640 |
Source: Public Records
Map
Nearby Homes
Your Personal Tour Guide
Ask me questions while you tour the home.