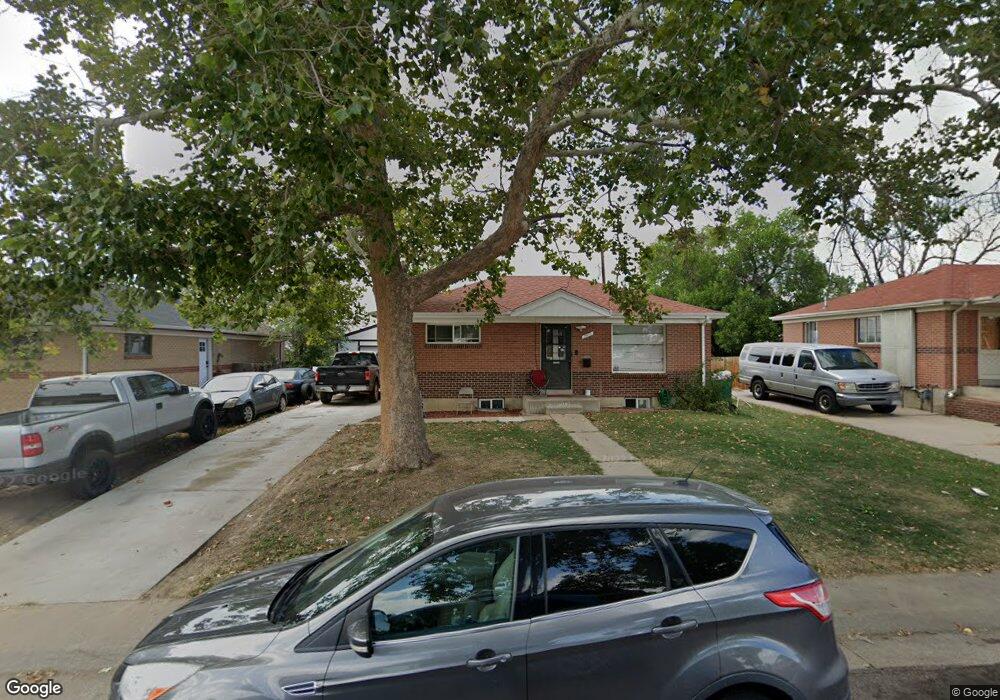
7973 Raritan St Denver, CO 80221
Sherrelwood NeighborhoodEstimated Value: $434,581 - $488,000
3
Beds
2
Baths
1,500
Sq Ft
$302/Sq Ft
Est. Value
About This Home
This home is located at 7973 Raritan St, Denver, CO 80221 and is currently estimated at $453,645, approximately $302 per square foot. 7973 Raritan St is a home located in Adams County with nearby schools including Metropolitan Arts Academy, Iver C. Ranum Middle School, and Westminster High School.
Ownership History
Date
Name
Owned For
Owner Type
Purchase Details
Closed on
Jan 18, 2022
Sold by
Rosalba Grajeda
Bought by
Grajeda Rosalba and Caldera Monica
Current Estimated Value
Purchase Details
Closed on
Jul 3, 2008
Sold by
Herrera Ivonne
Bought by
Grajeda Rosalba
Home Financials for this Owner
Home Financials are based on the most recent Mortgage that was taken out on this home.
Original Mortgage
$125,037
Interest Rate
5.99%
Mortgage Type
FHA
Purchase Details
Closed on
Dec 4, 2003
Sold by
Kirby Kerry R
Bought by
Herrera Ivonne
Home Financials for this Owner
Home Financials are based on the most recent Mortgage that was taken out on this home.
Original Mortgage
$124,800
Interest Rate
5.94%
Mortgage Type
Unknown
Purchase Details
Closed on
May 8, 1997
Sold by
Kirby Elizabeth M
Bought by
Kirby Kerry R
Purchase Details
Closed on
Oct 1, 1991
Create a Home Valuation Report for This Property
The Home Valuation Report is an in-depth analysis detailing your home's value as well as a comparison with similar homes in the area
Home Values in the Area
Average Home Value in this Area
Purchase History
| Date | Buyer | Sale Price | Title Company |
|---|---|---|---|
| Grajeda Rosalba | -- | None Listed On Document | |
| Grajeda Rosalba | $127,000 | Chicago Title Co | |
| Herrera Ivonne | $156,000 | Guardian Title Agency Llc | |
| Kirby Kerry R | -- | -- | |
| -- | $61,000 | -- |
Source: Public Records
Mortgage History
| Date | Status | Borrower | Loan Amount |
|---|---|---|---|
| Previous Owner | Grajeda Rosalba | $125,037 | |
| Previous Owner | Herrera Ivonne | $124,800 | |
| Closed | Herrera Ivonne | $31,200 |
Source: Public Records
Tax History Compared to Growth
Tax History
| Year | Tax Paid | Tax Assessment Tax Assessment Total Assessment is a certain percentage of the fair market value that is determined by local assessors to be the total taxable value of land and additions on the property. | Land | Improvement |
|---|---|---|---|---|
| 2024 | $3,122 | $27,690 | $5,630 | $22,060 |
| 2023 | $3,114 | $29,960 | $5,610 | $24,350 |
| 2022 | $3,041 | $24,260 | $5,770 | $18,490 |
| 2021 | $3,094 | $24,260 | $5,770 | $18,490 |
| 2020 | $2,817 | $22,360 | $5,790 | $16,570 |
| 2019 | $2,806 | $22,360 | $5,790 | $16,570 |
| 2018 | $2,236 | $17,490 | $5,620 | $11,870 |
| 2017 | $1,969 | $17,490 | $5,620 | $11,870 |
| 2016 | $1,527 | $13,280 | $2,710 | $10,570 |
| 2015 | $1,524 | $13,280 | $2,710 | $10,570 |
| 2014 | -- | $12,110 | $2,230 | $9,880 |
Source: Public Records
Map
Nearby Homes
- 7918 Tejon St
- 7875 Cyd Dr
- 7820 Tejon St
- 7956 Osage St
- 7819 Tejon St
- 8188 Pecos Way
- 1390 W 78th Cir
- 8247 Vanguard Dr
- 2420 W 80th Ave
- 7733 Navajo St
- 1466 Elmwood Ln
- 7973 Greenwood Blvd
- 2200 W 82nd Place
- 7883 Greenwood Blvd
- 7625 Turner Dr
- 1303 Lipan Dr
- 7898 Applewood Ln
- 7610 Tejon St
- 7961 Granada Rd
- 7663 Navajo St
- 7983 Raritan St
- 7963 Raritan St
- 7995 Raritan St
- 7953 Raritan St
- 1920 W 79th Way
- 7976 Cyd Dr
- 7997 Raritan St
- 7943 Raritan St
- 1900 W 79th Way
- 1921 W 79th Way
- 7966 Cyd Dr
- 7956 Shoshone St
- 7933 Raritan St
- 1780 W 79th Way
- 1881 W 79th Way
- 7934 Raritan St
- 8005 Raritan St
- 7940 Shoshone St
- 8006 Raritan St
- 7923 Raritan St