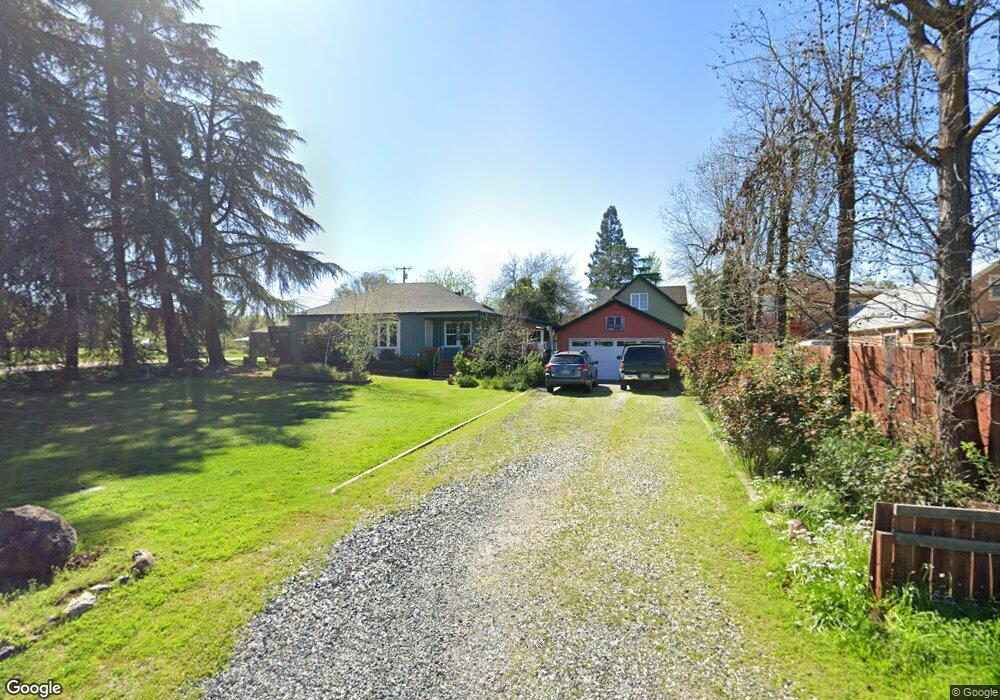
7974 Twin Oaks Ave Citrus Heights, CA 95610
Estimated Value: $365,000 - $482,385
3
Beds
1
Bath
1,092
Sq Ft
$405/Sq Ft
Est. Value
About This Home
This home is located at 7974 Twin Oaks Ave, Citrus Heights, CA 95610 and is currently estimated at $441,846, approximately $404 per square foot. 7974 Twin Oaks Ave is a home located in Sacramento County with nearby schools including Mariposa Avenue Elementary School, Sylvan Middle School, and Mesa Verde High School.
Ownership History
Date
Name
Owned For
Owner Type
Purchase Details
Closed on
Apr 6, 2020
Sold by
Butler Patrick E and Butler Donna L
Bought by
Butler Patrick E and Butler Donna L
Current Estimated Value
Home Financials for this Owner
Home Financials are based on the most recent Mortgage that was taken out on this home.
Original Mortgage
$50,000
Outstanding Balance
$25,091
Interest Rate
3.5%
Mortgage Type
New Conventional
Estimated Equity
$416,755
Purchase Details
Closed on
Mar 22, 2018
Sold by
Butler Patrick E and Butler Donna L
Bought by
Butler Patrick E and Butler Donna L
Purchase Details
Closed on
Jun 19, 2002
Sold by
Butler Patrick E and Butler Donna L
Bought by
Butler Patrick E and Butler Donna L
Home Financials for this Owner
Home Financials are based on the most recent Mortgage that was taken out on this home.
Original Mortgage
$15,000
Interest Rate
6.86%
Mortgage Type
Stand Alone Second
Create a Home Valuation Report for This Property
The Home Valuation Report is an in-depth analysis detailing your home's value as well as a comparison with similar homes in the area
Home Values in the Area
Average Home Value in this Area
Purchase History
| Date | Buyer | Sale Price | Title Company |
|---|---|---|---|
| Butler Patrick E | -- | Placer Title Company | |
| Butler Patrick E | -- | None Available | |
| Butler Patrick E | -- | -- |
Source: Public Records
Mortgage History
| Date | Status | Borrower | Loan Amount |
|---|---|---|---|
| Open | Butler Patrick E | $50,000 | |
| Previous Owner | Butler Patrick E | $15,000 |
Source: Public Records
Tax History Compared to Growth
Tax History
| Year | Tax Paid | Tax Assessment Tax Assessment Total Assessment is a certain percentage of the fair market value that is determined by local assessors to be the total taxable value of land and additions on the property. | Land | Improvement |
|---|---|---|---|---|
| 2025 | $866 | $245,747 | $58,553 | $187,194 |
| 2024 | $866 | $240,929 | $57,405 | $183,524 |
| 2023 | $908 | $236,206 | $56,280 | $179,926 |
| 2022 | $999 | $231,576 | $55,177 | $176,399 |
| 2021 | $977 | $227,037 | $54,096 | $172,941 |
| 2020 | $992 | $224,710 | $53,542 | $171,168 |
| 2019 | $985 | $220,305 | $52,493 | $167,812 |
| 2018 | $998 | $215,986 | $51,464 | $164,522 |
| 2017 | $1,003 | $211,752 | $50,455 | $161,297 |
| 2016 | $946 | $207,601 | $49,466 | $158,135 |
| 2015 | $921 | $204,483 | $48,723 | $155,760 |
| 2014 | $890 | $200,478 | $47,769 | $152,709 |
Source: Public Records
Map
Nearby Homes
- 8324 Sunrise Blvd
- 1439 New England Dr
- 0 Charlotte Ave
- 1529 Pine Valley Cir
- 8206 Peregrine Way
- 8232 Garry Oak Dr
- 8142 Patton Ave
- 7919 Wonder St
- 1364 Sun Tree Dr
- 1527 Crestmont Ave
- 8058 Mesa Oak Way
- 8024 Glen Briar Dr
- 1003 Morro Ct
- 1302 Mossbrook Ct
- 7925 Clearview Dr
- 501 Evening Breeze Ct
- 1501 Crestmont Ave
- 1513 Crestmont Oak Dr
- 8031 Mariposa Ave
- 8915 Livoti Ct
- 8349 Garino Ln
- 7948 Twin Oaks Ave
- 7940 Twin Oaks Ave
- 8400 Blossom Hill Ct
- 8408 Blossom Hill Ct
- 7932 Twin Oaks Ave
- 8401 Blossom Hill Ct
- 8324 Garino Ln
- 8416 Blossom Hill Ct
- 7975 Twin Oaks Ave
- 8407 Blossom Hill Ct
- 7990 Twin Oaks Ave
- 7926 Twin Oaks Ave
- 7979 Twin Oaks Ave
- 8415 Blossom Hill Ct
- 8422 Blossom Hill Ct
- 7925 Twin Oaks Ave
- 7978 Twin Oaks Ave
- 7924 Twin Oaks Ave
- 8421 Blossom Hill Ct