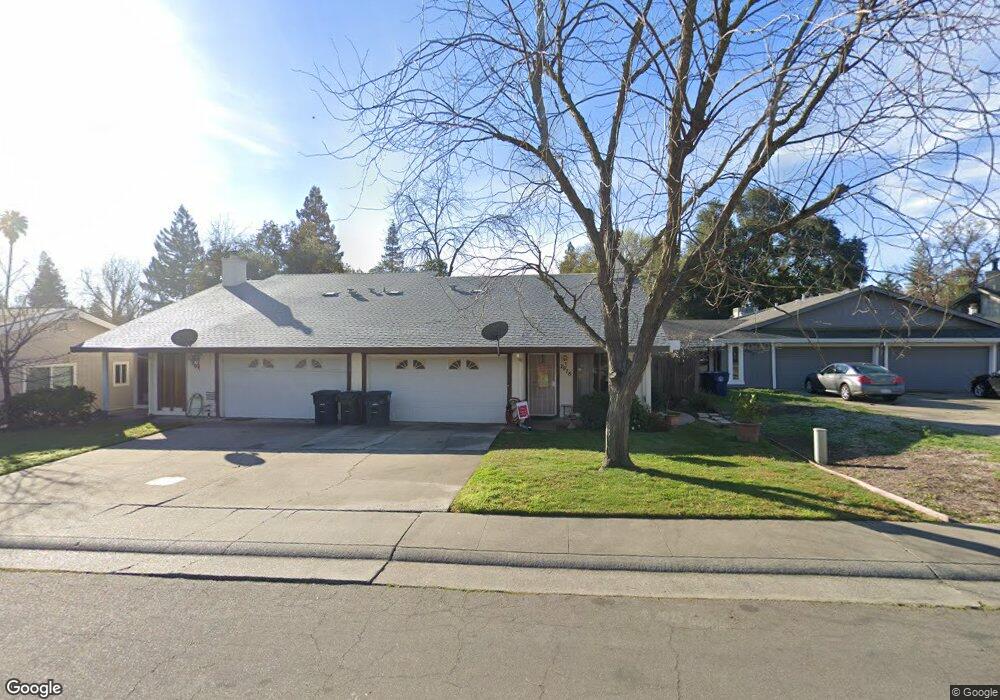
7978 Marsala Ct Citrus Heights, CA 95610
Estimated Value: $661,000 - $832,000
5
Beds
4
Baths
2,657
Sq Ft
$272/Sq Ft
Est. Value
About This Home
This home is located at 7978 Marsala Ct, Citrus Heights, CA 95610 and is currently estimated at $723,798, approximately $272 per square foot. 7978 Marsala Ct is a home located in Sacramento County with nearby schools including Northridge Elementary School, Andrew Carnegie Middle School, and Bella Vista High School.
Ownership History
Date
Name
Owned For
Owner Type
Purchase Details
Closed on
Jun 27, 2014
Sold by
Barrie O Donnell Barrie Fay and Donnell Barrie O
Bought by
Donnell Barrie F O and Barrie F O Donnell 2014 Living
Current Estimated Value
Purchase Details
Closed on
Sep 3, 2004
Sold by
Mdm Properties Llc
Bought by
Odonnell Barrie
Home Financials for this Owner
Home Financials are based on the most recent Mortgage that was taken out on this home.
Original Mortgage
$363,200
Outstanding Balance
$173,784
Interest Rate
5.37%
Mortgage Type
Purchase Money Mortgage
Estimated Equity
$550,014
Purchase Details
Closed on
Jun 4, 2004
Sold by
Wright Barbara D
Bought by
Mdm Properties Llc
Purchase Details
Closed on
Nov 19, 1996
Sold by
Simpson Barbara A Desmangles
Bought by
Wright Barbara D
Home Financials for this Owner
Home Financials are based on the most recent Mortgage that was taken out on this home.
Original Mortgage
$115,000
Interest Rate
7.88%
Create a Home Valuation Report for This Property
The Home Valuation Report is an in-depth analysis detailing your home's value as well as a comparison with similar homes in the area
Home Values in the Area
Average Home Value in this Area
Purchase History
| Date | Buyer | Sale Price | Title Company |
|---|---|---|---|
| Donnell Barrie F O | -- | None Available | |
| Odonnell Barrie | $454,500 | Placer Title Company | |
| Mdm Properties Llc | $400,000 | Placer Title Company | |
| Wright Barbara D | $195,000 | Placer Title Company |
Source: Public Records
Mortgage History
| Date | Status | Borrower | Loan Amount |
|---|---|---|---|
| Open | Odonnell Barrie | $363,200 | |
| Previous Owner | Wright Barbara D | $115,000 |
Source: Public Records
Tax History Compared to Growth
Tax History
| Year | Tax Paid | Tax Assessment Tax Assessment Total Assessment is a certain percentage of the fair market value that is determined by local assessors to be the total taxable value of land and additions on the property. | Land | Improvement |
|---|---|---|---|---|
| 2025 | $7,489 | $633,515 | $174,230 | $459,285 |
| 2024 | $7,489 | $621,094 | $170,814 | $450,280 |
| 2023 | $7,299 | $608,916 | $167,465 | $441,451 |
| 2022 | $7,261 | $596,978 | $164,182 | $432,796 |
| 2021 | $6,506 | $532,950 | $123,942 | $409,008 |
| 2020 | $5,688 | $469,560 | $109,200 | $360,360 |
| 2019 | $5,468 | $451,500 | $105,000 | $346,500 |
| 2018 | $6,789 | $556,781 | $153,128 | $403,653 |
| 2017 | $6,723 | $545,865 | $150,126 | $395,739 |
| 2016 | $6,280 | $535,163 | $147,183 | $387,980 |
| 2015 | $5,827 | $497,334 | $136,780 | $360,554 |
| 2014 | $5,543 | $473,652 | $130,267 | $343,385 |
Source: Public Records
Map
Nearby Homes
- 5573 Rubion Cir
- 5628 Spyglass Ln
- 5507 Rubion Cir
- 5611 Seascape Ct
- 5409 Vin Rose Ct
- 7908 Rocky Point Ct
- 5639 Cypress Point Dr
- 5453 Ventana Place
- 5703 Celine Dr
- 5632 Albert Ln
- 8119 Treecrest Ave
- 8140 Maderia Port Ln
- 8136 Niessen Way
- 7912 Wildridge Dr
- 5150 Sunrise Hills Dr
- 8124 Sunrise East Way
- 5333 Primrose Dr Unit 43B
- 5333 Primrose Dr
- 5333 Primrose Dr Unit 17B
- 5333 Primrose Dr Unit 40B
- 7974 Marsala Ct
- 7984 Marsala Ct
- 7982 Marsala Ct
- 7983 Alta Vista Ln
- 7979 Alta Vista Ln
- 7996 Marsala Ct
- 7979 Marsala Ct
- 7970 Marsala Ct
- 7975 Marsala Ct
- 7975 Alta Vista Ln
- 7983 Marsala Ct
- 7971 Marsala Ct
- 7987 Marsala Ct
- 7971 Alta Vista Ln
- 5648 Spyglass Ln
- 7995 Marsala Ct
- 5569 Rubion Cir
- 5577 Rubion Cir
- 5565 Rubion Cir
- 5624 Spyglass Ln