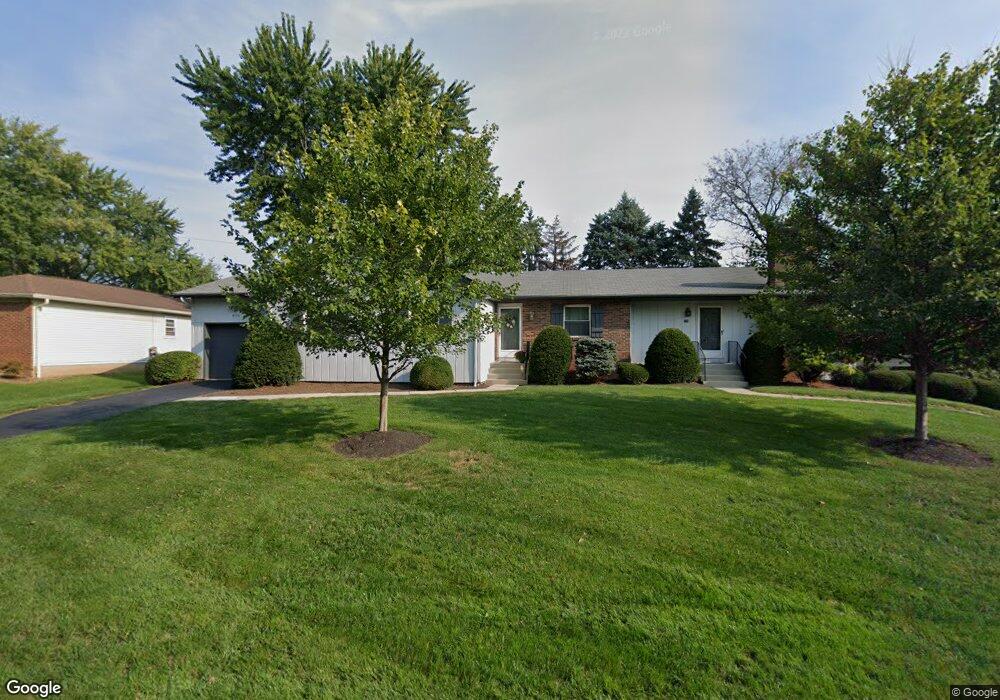
798 Linworth Rd E Unit 800 Columbus, OH 43235
Estimated Value: $416,000 - $555,452
4
Beds
4
Baths
2,448
Sq Ft
$190/Sq Ft
Est. Value
About This Home
This home is located at 798 Linworth Rd E Unit 800, Columbus, OH 43235 and is currently estimated at $465,113, approximately $189 per square foot. 798 Linworth Rd E Unit 800 is a home located in Franklin County with nearby schools including Bluffsview Elementary School, McCord Middle School, and Worthington Kilbourne High School.
Ownership History
Date
Name
Owned For
Owner Type
Purchase Details
Closed on
Apr 23, 2021
Sold by
Hurak Douglas S
Bought by
Moon Robert J
Current Estimated Value
Home Financials for this Owner
Home Financials are based on the most recent Mortgage that was taken out on this home.
Original Mortgage
$271,200
Outstanding Balance
$245,252
Interest Rate
3.1%
Mortgage Type
New Conventional
Estimated Equity
$219,861
Purchase Details
Closed on
Nov 25, 2008
Sold by
Carlson Esther Jane
Bought by
Hurak Douglas S
Home Financials for this Owner
Home Financials are based on the most recent Mortgage that was taken out on this home.
Original Mortgage
$187,000
Interest Rate
6.49%
Mortgage Type
Purchase Money Mortgage
Purchase Details
Closed on
Mar 26, 1976
Bought by
Carlson Randolph R
Create a Home Valuation Report for This Property
The Home Valuation Report is an in-depth analysis detailing your home's value as well as a comparison with similar homes in the area
Home Values in the Area
Average Home Value in this Area
Purchase History
| Date | Buyer | Sale Price | Title Company |
|---|---|---|---|
| Moon Robert J | $339,000 | Northwest Select Ttl Agcy Ll | |
| Hurak Douglas S | $220,000 | Attorney | |
| Carlson Randolph R | $78,900 | -- |
Source: Public Records
Mortgage History
| Date | Status | Borrower | Loan Amount |
|---|---|---|---|
| Open | Moon Robert J | $271,200 | |
| Previous Owner | Hurak Douglas S | $187,000 |
Source: Public Records
Tax History Compared to Growth
Tax History
| Year | Tax Paid | Tax Assessment Tax Assessment Total Assessment is a certain percentage of the fair market value that is determined by local assessors to be the total taxable value of land and additions on the property. | Land | Improvement |
|---|---|---|---|---|
| 2024 | $8,053 | $129,890 | $41,130 | $88,760 |
| 2023 | $7,704 | $129,890 | $41,130 | $88,760 |
| 2022 | $6,527 | $85,300 | $26,460 | $58,840 |
| 2021 | $5,889 | $85,300 | $26,460 | $58,840 |
| 2020 | $5,674 | $85,300 | $26,460 | $58,840 |
| 2019 | $5,472 | $74,200 | $23,030 | $51,170 |
| 2018 | $5,439 | $74,200 | $23,030 | $51,170 |
| 2017 | $4,912 | $74,200 | $23,030 | $51,170 |
| 2016 | $5,573 | $77,420 | $14,700 | $62,720 |
| 2015 | $5,574 | $77,420 | $14,700 | $62,720 |
| 2014 | $5,572 | $77,420 | $14,700 | $62,720 |
| 2013 | $2,520 | $70,350 | $13,335 | $57,015 |
Source: Public Records
Map
Nearby Homes
- 7522 Acela St
- 1101 Bluffway Dr
- 1109 Bluffway Dr
- 1041 Rosebank Dr
- 1232 Lochcarren Ct
- 865 Colony Way
- 210 Saint Antoine St Unit 25D
- 1380 Tiehack Ct
- 203 Saint Pierre St
- 7187 Lorine Ct
- 941 Clubview Blvd S
- 6908 Perry Dr
- 7164 Durness Place
- 445 Thackeray Ave
- 7347 Fall Creek Ln Unit J
- 835 Clubview Blvd N
- 1620 Park Row Dr Unit A
- 8144 Mount Air Place Unit 8144
- 1678 Park Row Dr Unit B
- 865 Highview Dr
- 812 Linworth Rd E Unit 814
- 824 Linworth Rd E Unit 826
- 811 Linworth Rd E
- 832 Linworth Rd E
- 834 Linworth Rd E Unit 832
- 7217 Old Redbud Ct Unit lot 7
- 7217 Old Redbud Ct
- 825 Linworth Rd E
- 0 Old Redbud Ct
- 0 Old Redbud Ct
- 0 Old Redbud Ct
- 0 Old Redbud Ct
- 793 Linworth Rd E
- 7204 Old Redbud Ct
- 842 Linworth Rd E Unit 844
- 7205 Old Redbud Ct
- 785 Linworth Rd E
- 7192 Old Redbud Ct Unit lot 2
- 7192 Old Redbud Ct
- 854-856 Linworth Rd E